Fig. 3.
Download original image
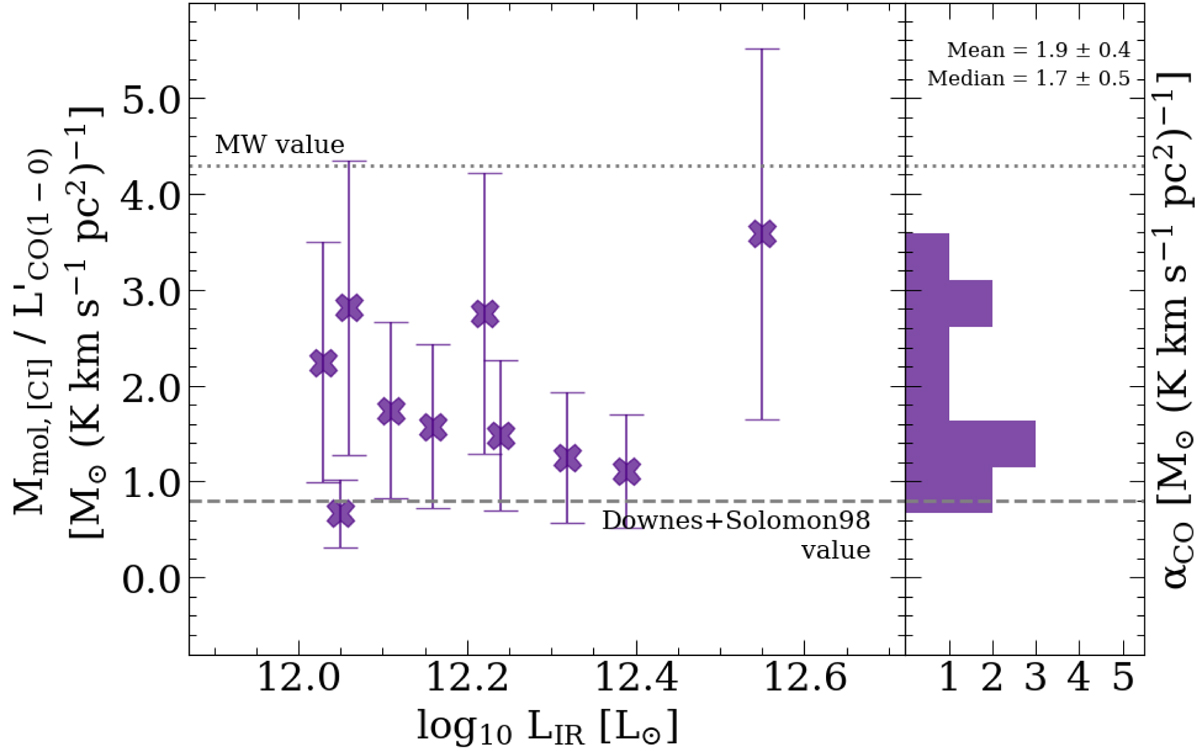
Ratio between [CI]-based molecular gas mass estimates and CO(1–0) line luminosity, computed for the ULIRGs in our sample that have both lines available, and plotted as a function of the infrared luminosity. This ratio is interpreted as the αCO factor (see Eq. (10)). The right part of the plot shows the resulting distribution of [CI]-based αCO values. The dotted line indicates the CO-to-H2 conversion factor for the Milky Way, and the dashed line corresponds to the value commonly used in the literature for (U)LIRGs (Downes & Solomon 1998). The mean and median values obtained for our sample (reported at the top-right corner) are αCO = 1.9 ± 0.4 M⊙ and 1.7 ± 0.5 M⊙ (K km s−1 pc2)−1, respectively.
Current usage metrics show cumulative count of Article Views (full-text article views including HTML views, PDF and ePub downloads, according to the available data) and Abstracts Views on Vision4Press platform.
Data correspond to usage on the plateform after 2015. The current usage metrics is available 48-96 hours after online publication and is updated daily on week days.
Initial download of the metrics may take a while.