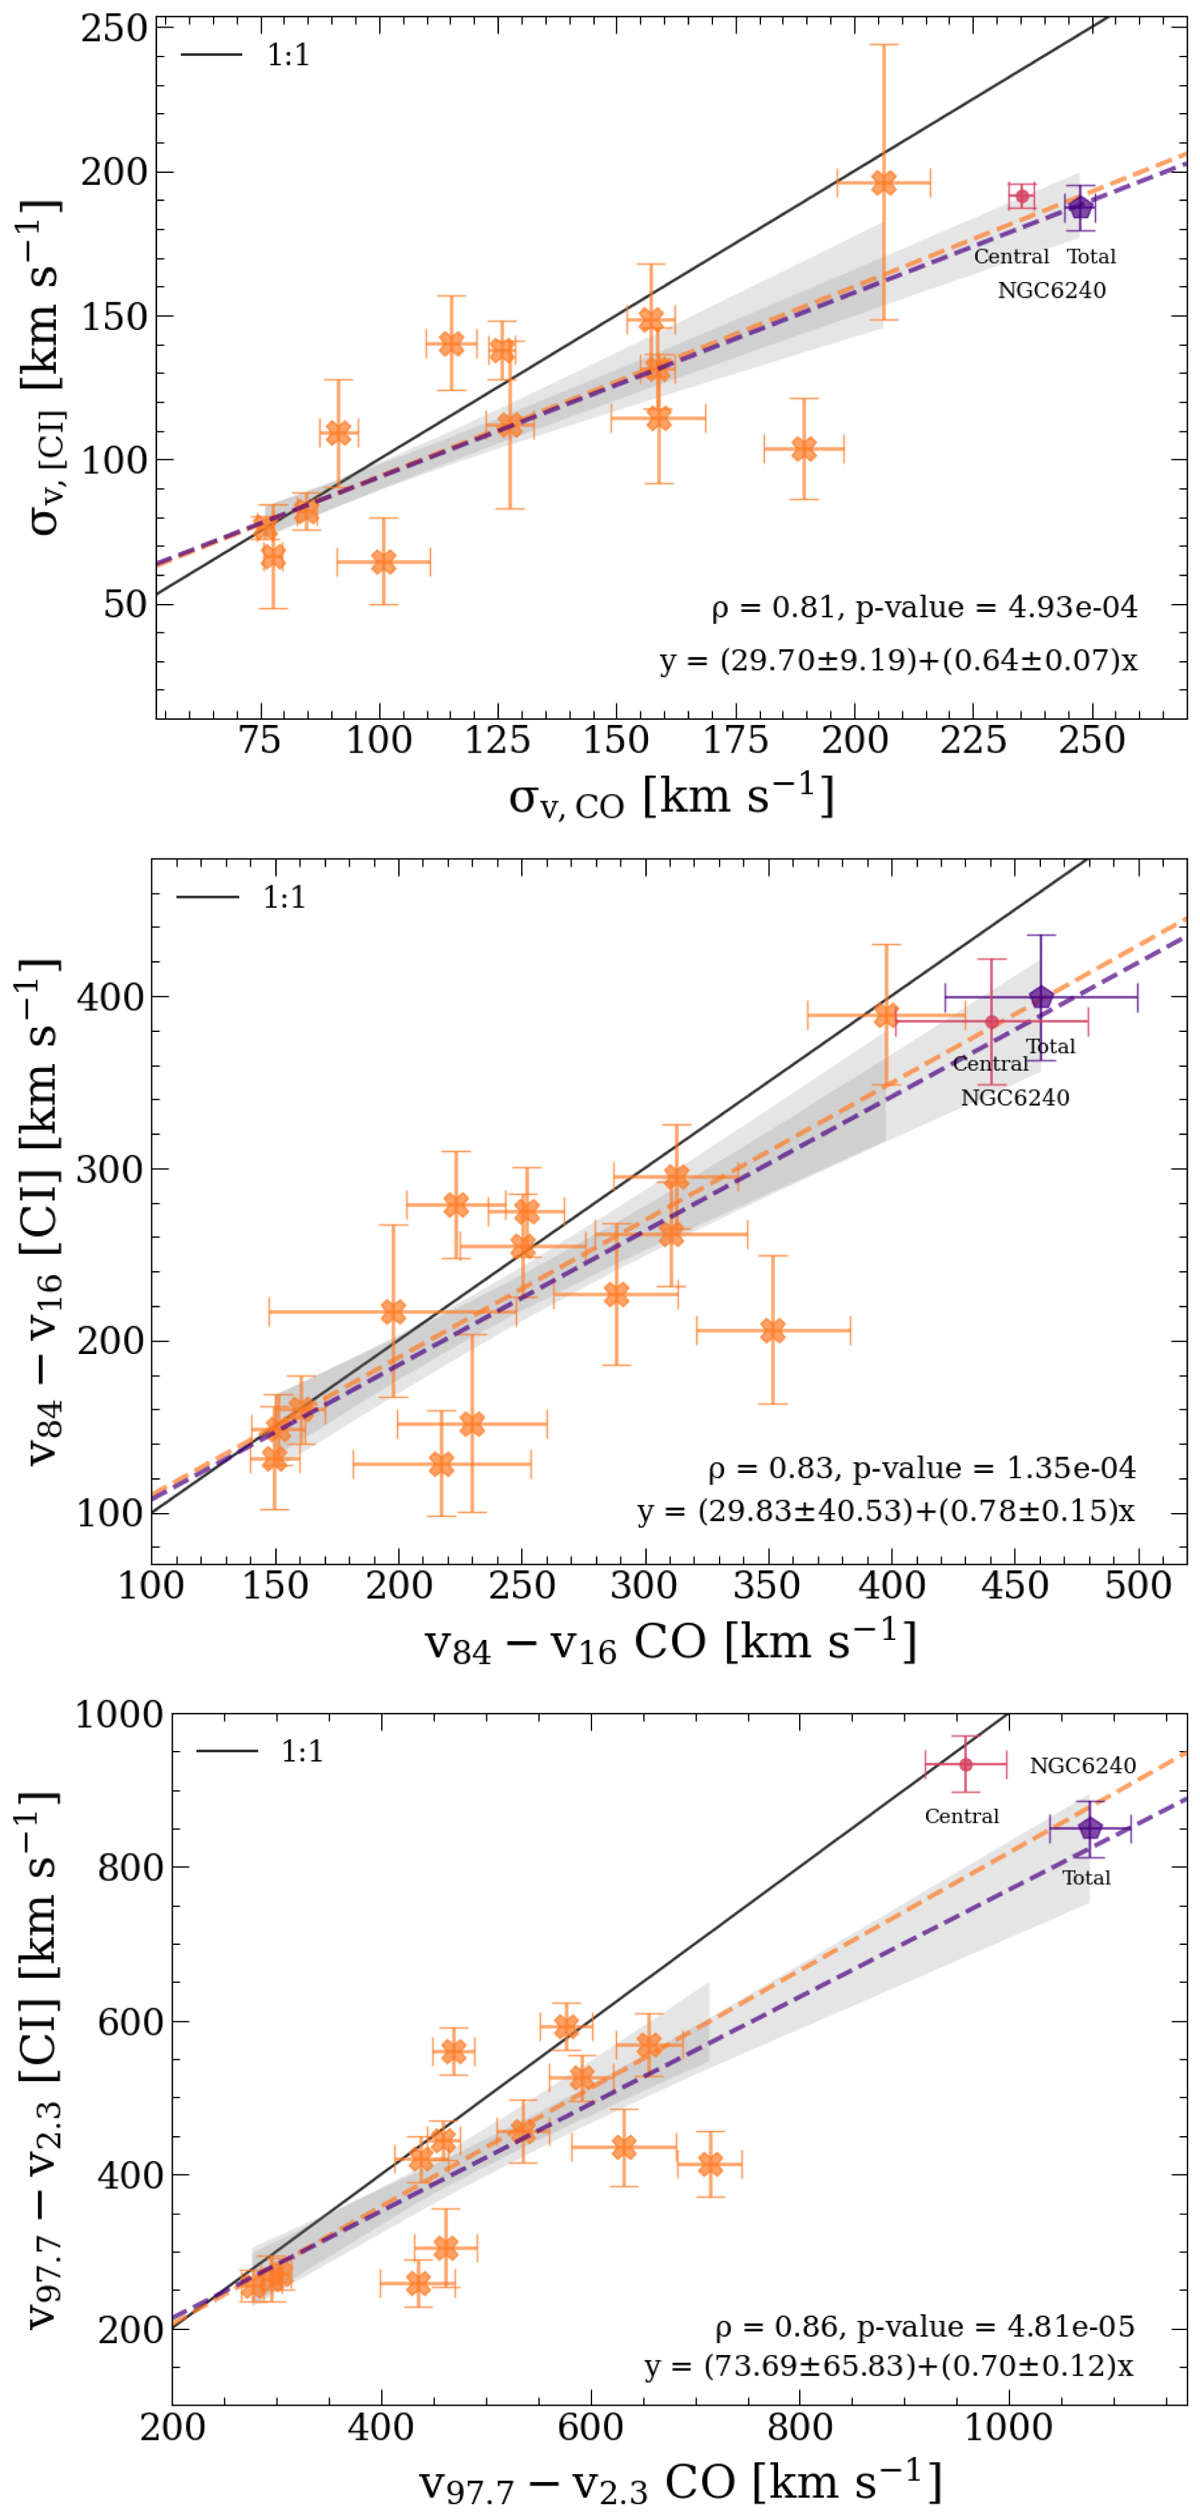
Fig. 2.
Download original image
[CI](1–0) line width as a function of the CO(2–1) line width. Top panel: Velocity dispersion (σv) obtained via a single Gaussian spectral fit to the [CI](1–0) and CO(2–1) emission lines. Middle and bottom panels: 16–84 (v84 − v16) and 2.3–97.7 (v97.7 − v2.3) percentile velocity intervals for CO and [CI], respectively, derived from the best-fit function obtained from the multi-Gaussian fit. Orange data points correspond to the ULIRGs sample analyzed in this work. The purple pentagon and the pink dot represent the values obtained for NGC 6240, respectively for the total region and for the inner ∼2″ (see Cicone et al. 2018, and the text in Sect. 5.1.2 for a more detailed explanation of the apertures used for spectra extraction). The solid black line indicates the 1:1 relation. The dashed orange line shows the best-fit relation obtained using only our sample, while the dashed purple line is the best-fit relation obtained for our sample plus NGC6240 (total). The shaded gray areas corresponds to the 1σ confidence interval of the two fits. At the bottom-right corner we report the Pearson correlation coefficient (ρ) and the p-values, as well as the best-fit coefficients of the purple fit.
Current usage metrics show cumulative count of Article Views (full-text article views including HTML views, PDF and ePub downloads, according to the available data) and Abstracts Views on Vision4Press platform.
Data correspond to usage on the plateform after 2015. The current usage metrics is available 48-96 hours after online publication and is updated daily on week days.
Initial download of the metrics may take a while.