Fig. A.3.
Download original image
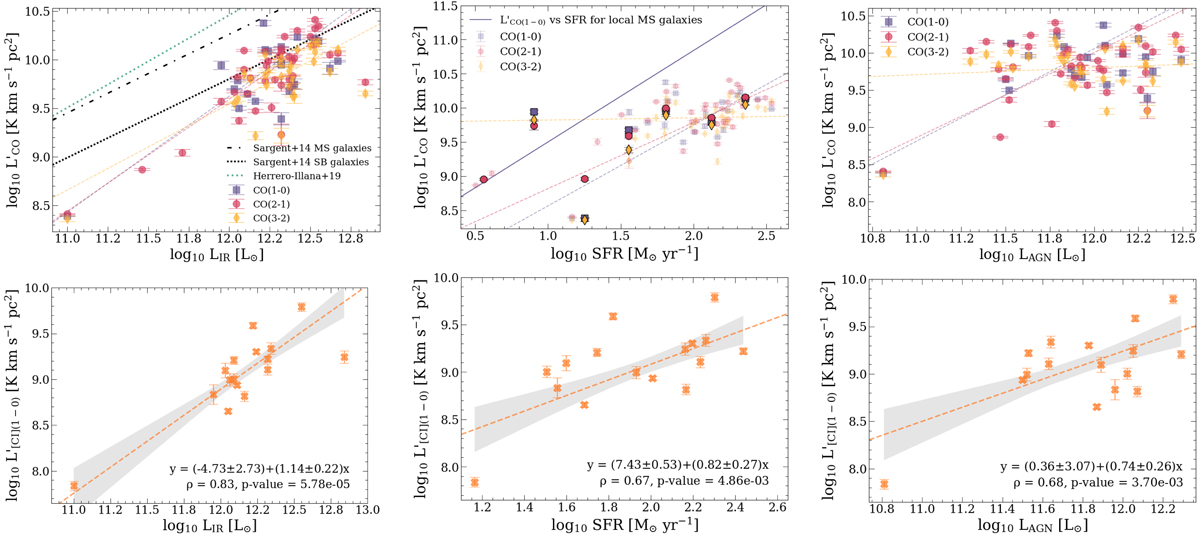
Same as Fig. 5, but now including the four LIRGs in the extended sample. In each plot, the dashed lines are the best-fit relations obtained from a least squares regression analysis conducted for each transition separately (color-coded according to the transition; see the legend in the top-left panel). In the bottom panels, the shaded gray areas correspond to the 1σ confidence interval of the fit. The bottom panels report also the Pearson correlation coefficients (ρ) and their associated p-values. The top-left panel shows also the ![]() -LIR relations found by Sargent et al. (2014) for local main-sequence (dot-dashed black line) and SB galaxies (dotted black line), and the
-LIR relations found by Sargent et al. (2014) for local main-sequence (dot-dashed black line) and SB galaxies (dotted black line), and the ![]() -LTIR relation obtained by Herrero-Illana et al. (2019) using IRAM 30m CO(1–0) observations of 55 local sources in the GOALS sample including mostly LIRGs with LIR < 1012 L⊙ and with a < 20% AGN contribution to LIR. In the top-middle panel, for better visualization, we over-plotted with darker colors the data in bins of SFRs. In this plot, the solid purple line represents the
-LTIR relation obtained by Herrero-Illana et al. (2019) using IRAM 30m CO(1–0) observations of 55 local sources in the GOALS sample including mostly LIRGs with LIR < 1012 L⊙ and with a < 20% AGN contribution to LIR. In the top-middle panel, for better visualization, we over-plotted with darker colors the data in bins of SFRs. In this plot, the solid purple line represents the ![]() -SFR best fit obtained by Cicone et al. (2017) for the ALLSMOG and COLD GASS samples of local star-forming galaxies, described by
-SFR best fit obtained by Cicone et al. (2017) for the ALLSMOG and COLD GASS samples of local star-forming galaxies, described by ![]() .
.
Current usage metrics show cumulative count of Article Views (full-text article views including HTML views, PDF and ePub downloads, according to the available data) and Abstracts Views on Vision4Press platform.
Data correspond to usage on the plateform after 2015. The current usage metrics is available 48-96 hours after online publication and is updated daily on week days.
Initial download of the metrics may take a while.