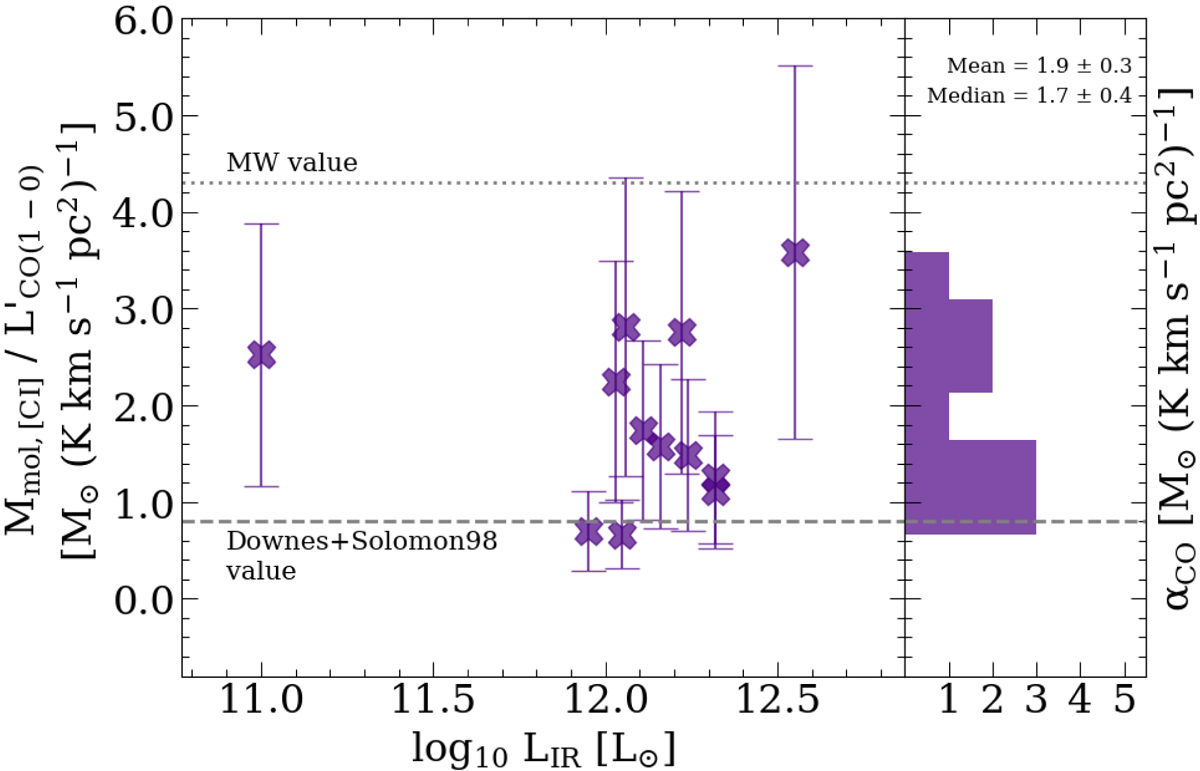
Fig. A.2.
Download original image
Same as Fig. 3, but now including the two LIRGs for which we have [CI](1–0) and CO(1–0) observations. The right part of the plot shows the resulting distribution of [CI]-based αCO values. The dotted line indicates the CO-to-H2 conversion factor for the Milky Way galaxy, and the dashed line corresponds to the value commonly used in the literature for (U)LIRGs (Downes & Solomon 1998). The mean and median values for the sample of (U)LIRGs remain the same as the ones obtained solely for the ULIRGs: αCO = 1.9 ± 0.3 M⊙ (K km s−1 pc2)−1 and 1.7 ± 0.4 M⊙ (K km s−1 pc2)−1 for the mean and median, respectively.
Current usage metrics show cumulative count of Article Views (full-text article views including HTML views, PDF and ePub downloads, according to the available data) and Abstracts Views on Vision4Press platform.
Data correspond to usage on the plateform after 2015. The current usage metrics is available 48-96 hours after online publication and is updated daily on week days.
Initial download of the metrics may take a while.