Open Access
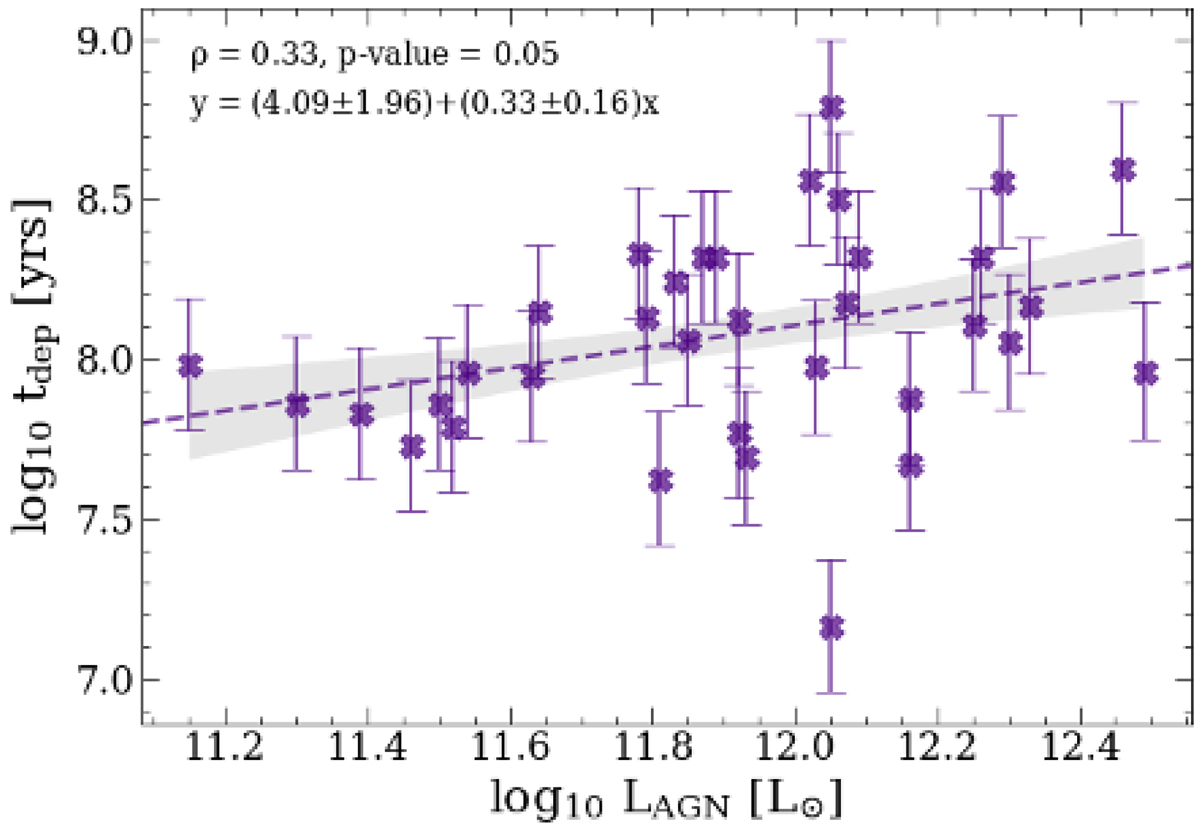
Fig. 14.
Download original image
Depletion timescale (τdep ≡ Mmol/SFR) plotted as a function of LAGN. The dashed line shows the best-fit relation and its 1σ confidence interval plotted as a shaded gray area. The best-fit parameters and the Pearson correlation coefficient are reported at the upper left corner of the panel.
Current usage metrics show cumulative count of Article Views (full-text article views including HTML views, PDF and ePub downloads, according to the available data) and Abstracts Views on Vision4Press platform.
Data correspond to usage on the plateform after 2015. The current usage metrics is available 48-96 hours after online publication and is updated daily on week days.
Initial download of the metrics may take a while.