Fig. 12.
Download original image
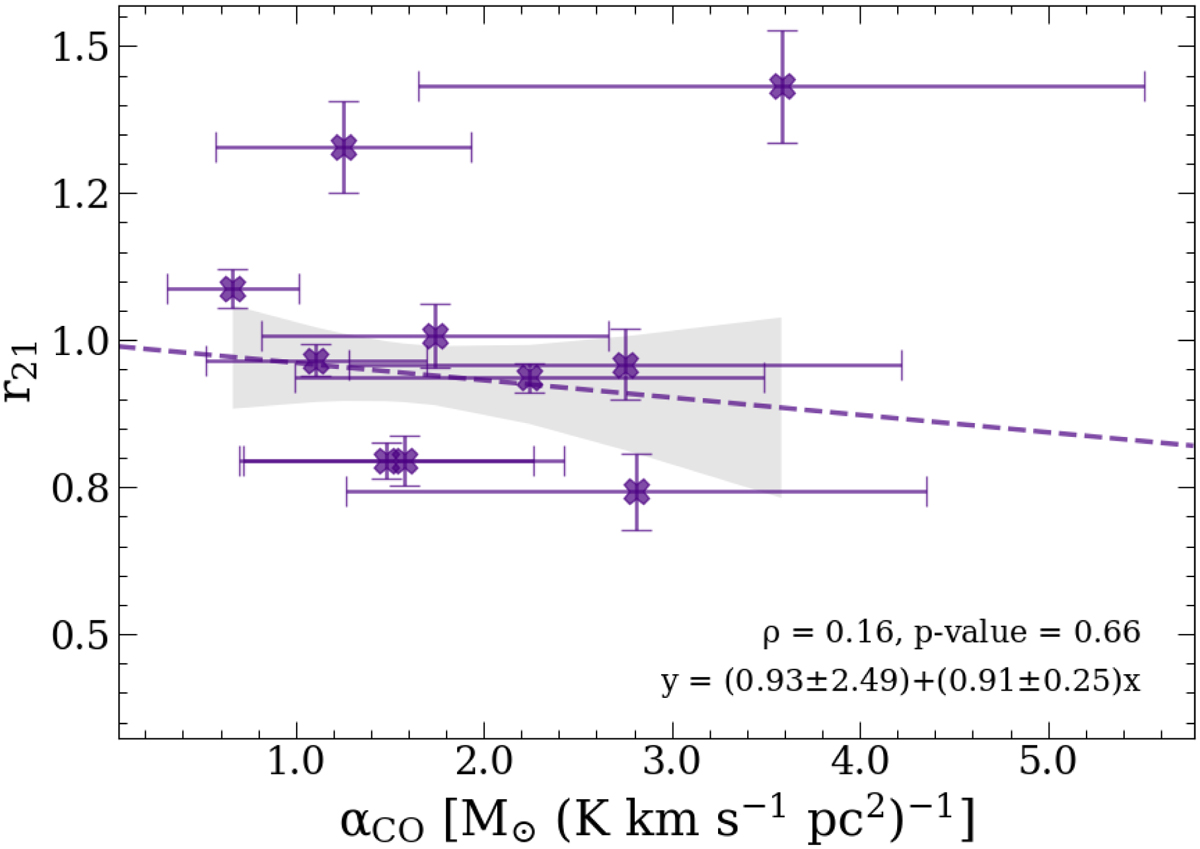
Global r21 ratios plotted as a function of [CI]-derived αCO values. The purple dashed line shows the best-fit relation, with its corresponding 1σ confidence interval represented by the gray shaded area. Neither the Pearson correlation coefficient (ρ) nor the regression analysis suggest any correlation between these quantities.
Current usage metrics show cumulative count of Article Views (full-text article views including HTML views, PDF and ePub downloads, according to the available data) and Abstracts Views on Vision4Press platform.
Data correspond to usage on the plateform after 2015. The current usage metrics is available 48-96 hours after online publication and is updated daily on week days.
Initial download of the metrics may take a while.