Fig. 11.
Download original image
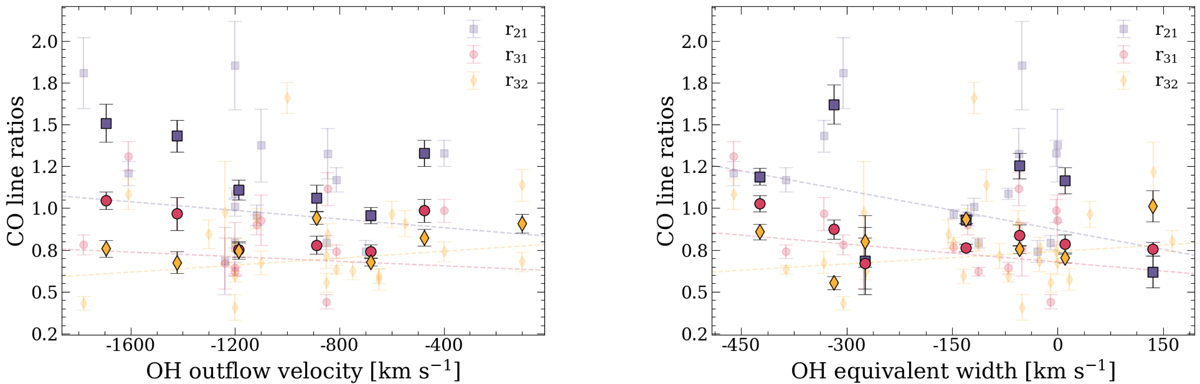
Global CO line ratios as a function of OHmax (left) and OHEQW (right) for the sources with OH119 μm data as reported in the literature (see Table 1). The binned values (computed in the same way as in Sect. 5.4) are shown using darker colors and overplotted on the individual data points. Dashed lines indicate the best-fit relations obtained from a least squares regression analysis conducted for each transition line separately. The color coding refers to different line ratios, as indicated in the legend at the top-right corner of each plot.
Current usage metrics show cumulative count of Article Views (full-text article views including HTML views, PDF and ePub downloads, according to the available data) and Abstracts Views on Vision4Press platform.
Data correspond to usage on the plateform after 2015. The current usage metrics is available 48-96 hours after online publication and is updated daily on week days.
Initial download of the metrics may take a while.