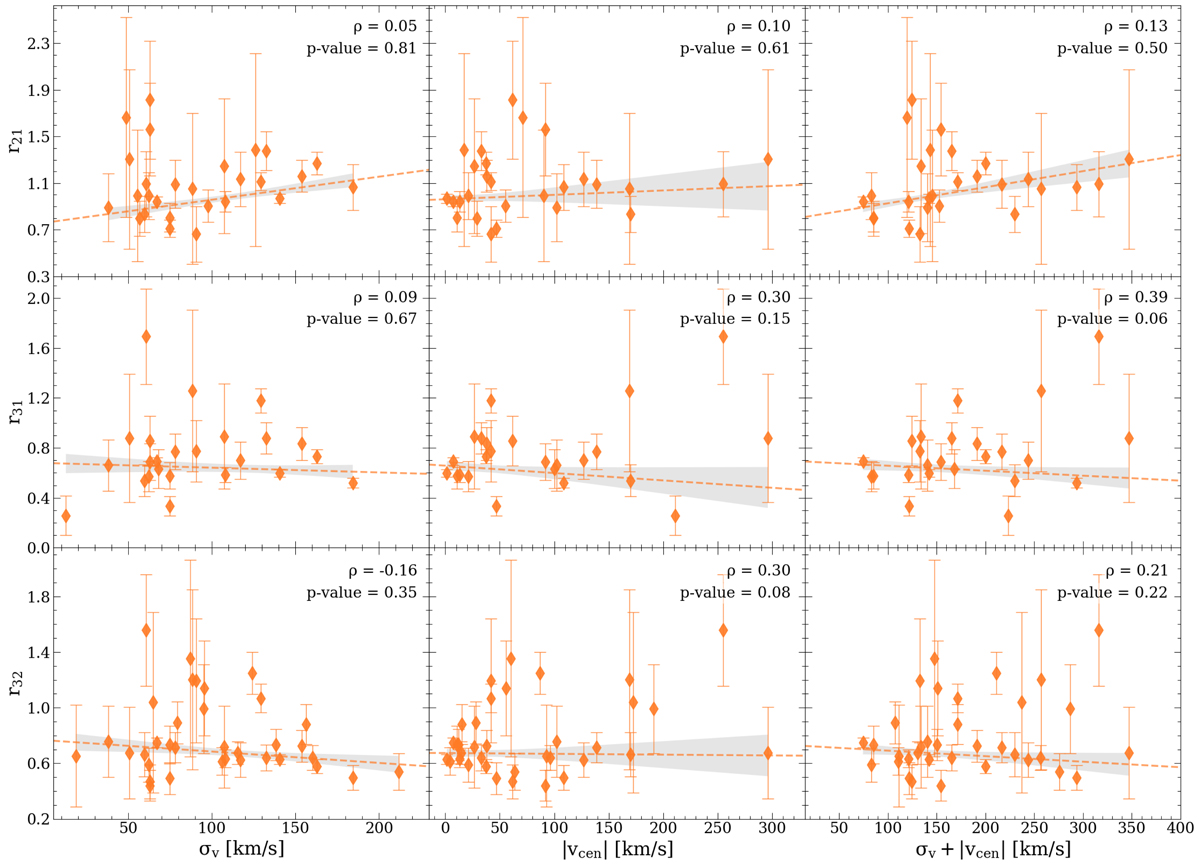
Fig. 10.
Download original image
Individual spectral component analysis of the CO line ratios as a function of the gas kinematics for our sample of ULIRGs. We set a detection threshold of 2σ for the flux of each Gaussian component in order to compute the ratios. The top, central, and bottom rows show, respectively, the r21, r31, and r32 plots. Left column: Line ratios as a function of the velocity dispersion, σv (line width of the spectral Gaussian component). Middle column: Line ratios as a function of the module of the central velocity of the spectral Gaussian component (|vcen|), measured with respect to the galaxy’s redshift, reported in Table 1. Right column: Line ratios as a function of the σv + |vcen| parameter. The dashed lines correspond to the best-fit relations obtained from a least squares regression analysis, and the shaded gray areas correspond to the 1σ confidence interval of the fit. The Pearson correlation coefficients and associated p-values are reported at the top-right corner of each plot, although they are less informative than the best fit because they do not take the (large) error bars into account.
Current usage metrics show cumulative count of Article Views (full-text article views including HTML views, PDF and ePub downloads, according to the available data) and Abstracts Views on Vision4Press platform.
Data correspond to usage on the plateform after 2015. The current usage metrics is available 48-96 hours after online publication and is updated daily on week days.
Initial download of the metrics may take a while.