Fig. 1.
Download original image
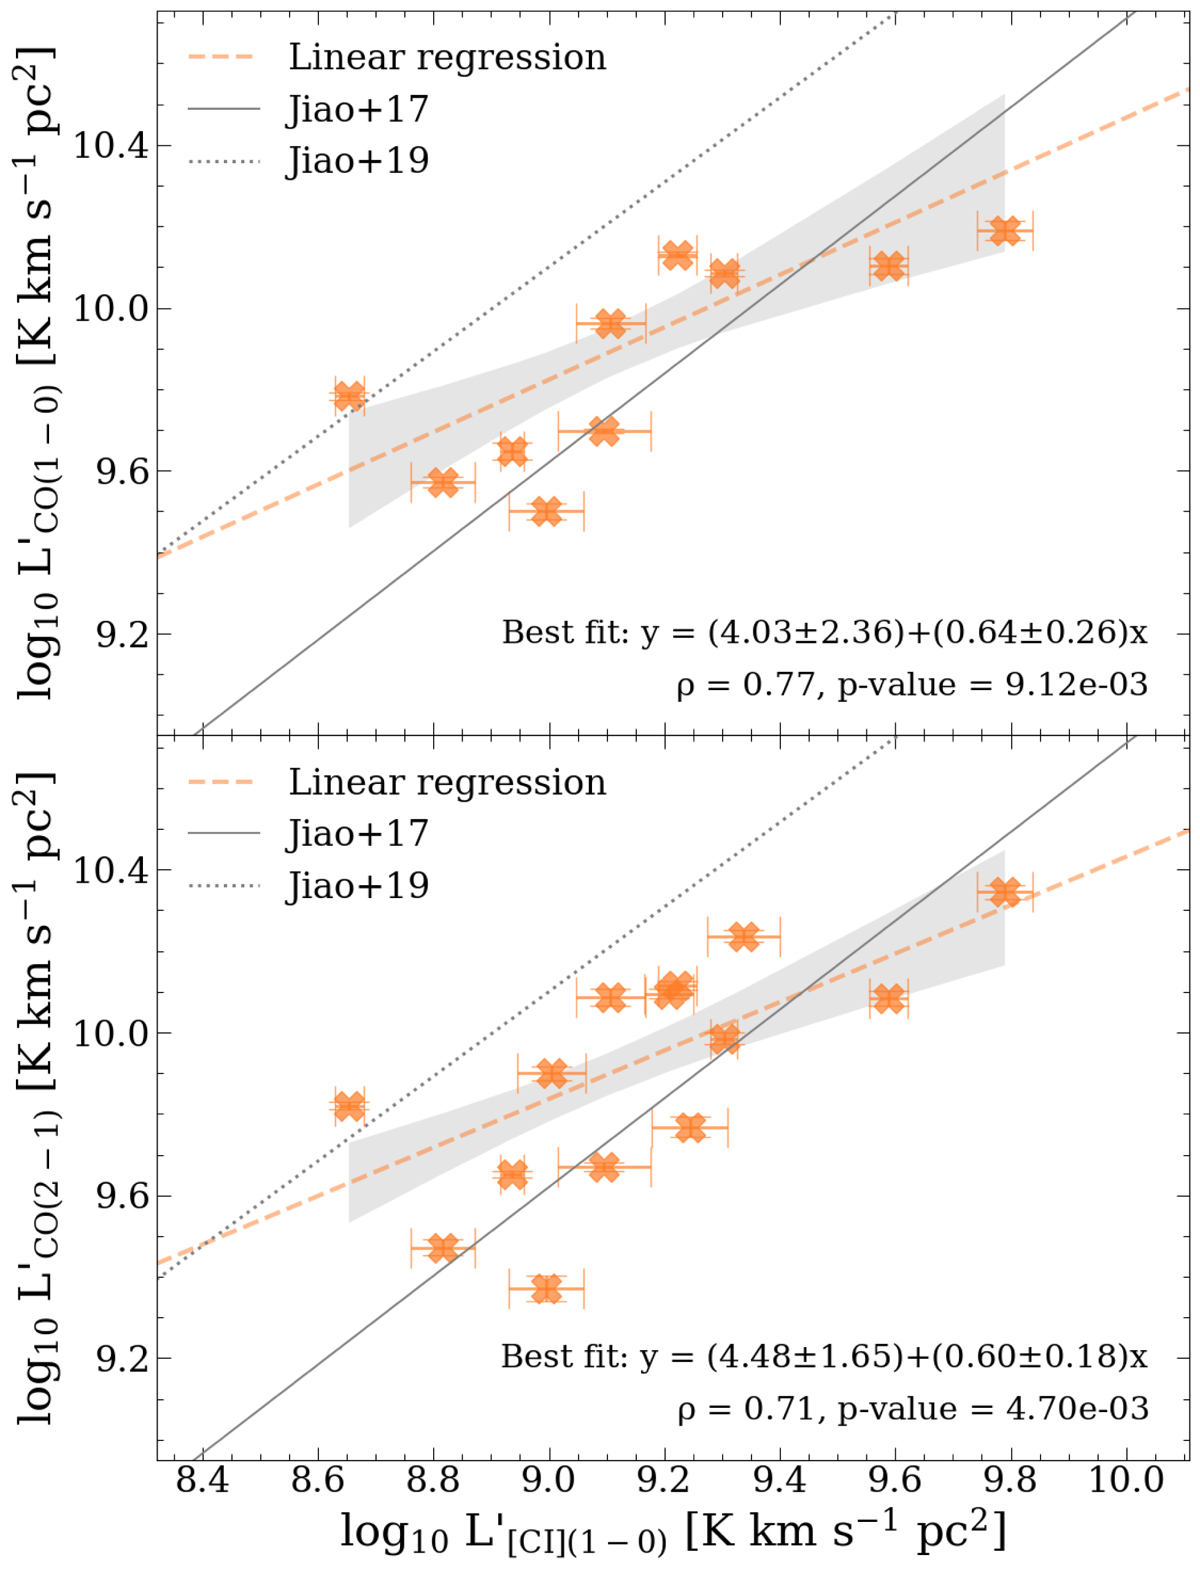
CO(1–0) vs. [CI](1–0) luminosity (top) and CO(2–1) vs. [CI](1–0) luminosity (bottom) for the ULIRGs in our sample. The best-fit relations are shown as dashed orange lines. The best-fit parameters are reported at the bottom-right corner of the plots. We also display the Pearson correlation coefficients (ρ) and their associated p-values. The solid black lines in both panels represent the corresponding relations reported by Jiao et al. (2017) for a sample of 71 (U)LIRGs, and the dotted lines represent the relations of Jiao et al. (2019) for a sample of 15 nearby spiral galaxies, between ![]() and
and ![]() .
.
Current usage metrics show cumulative count of Article Views (full-text article views including HTML views, PDF and ePub downloads, according to the available data) and Abstracts Views on Vision4Press platform.
Data correspond to usage on the plateform after 2015. The current usage metrics is available 48-96 hours after online publication and is updated daily on week days.
Initial download of the metrics may take a while.