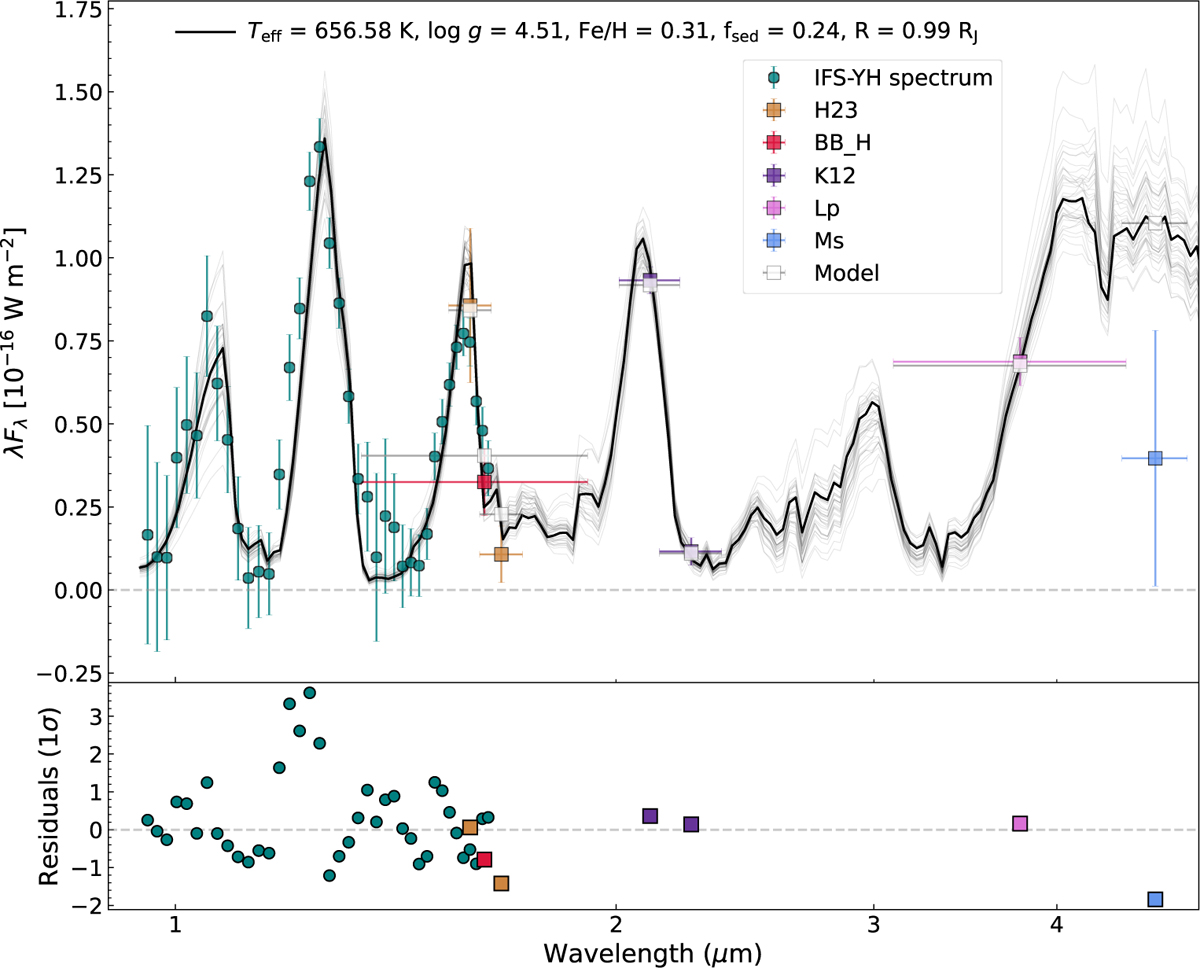
Fig. D.1
Download original image
petitRADTRANS best-fit spectrum of 51 Eri b for the 'enforced clouds' retrieval run on our new SPHERE spectro-photometric data (teal circles and purple squares) along with the photometric points included in Samland et al. (2017) (shown as squares). The photometric points describe the average flux in the respective filter, the x-error bar represents the filter widths. 34 randomly drawn samples from the posterior probability distribution are shown in gray, to show the spread of model parameter combinations to fit the data. Residuals in multiples of 1σ uncertainties of the data are shown below.
Current usage metrics show cumulative count of Article Views (full-text article views including HTML views, PDF and ePub downloads, according to the available data) and Abstracts Views on Vision4Press platform.
Data correspond to usage on the plateform after 2015. The current usage metrics is available 48-96 hours after online publication and is updated daily on week days.
Initial download of the metrics may take a while.