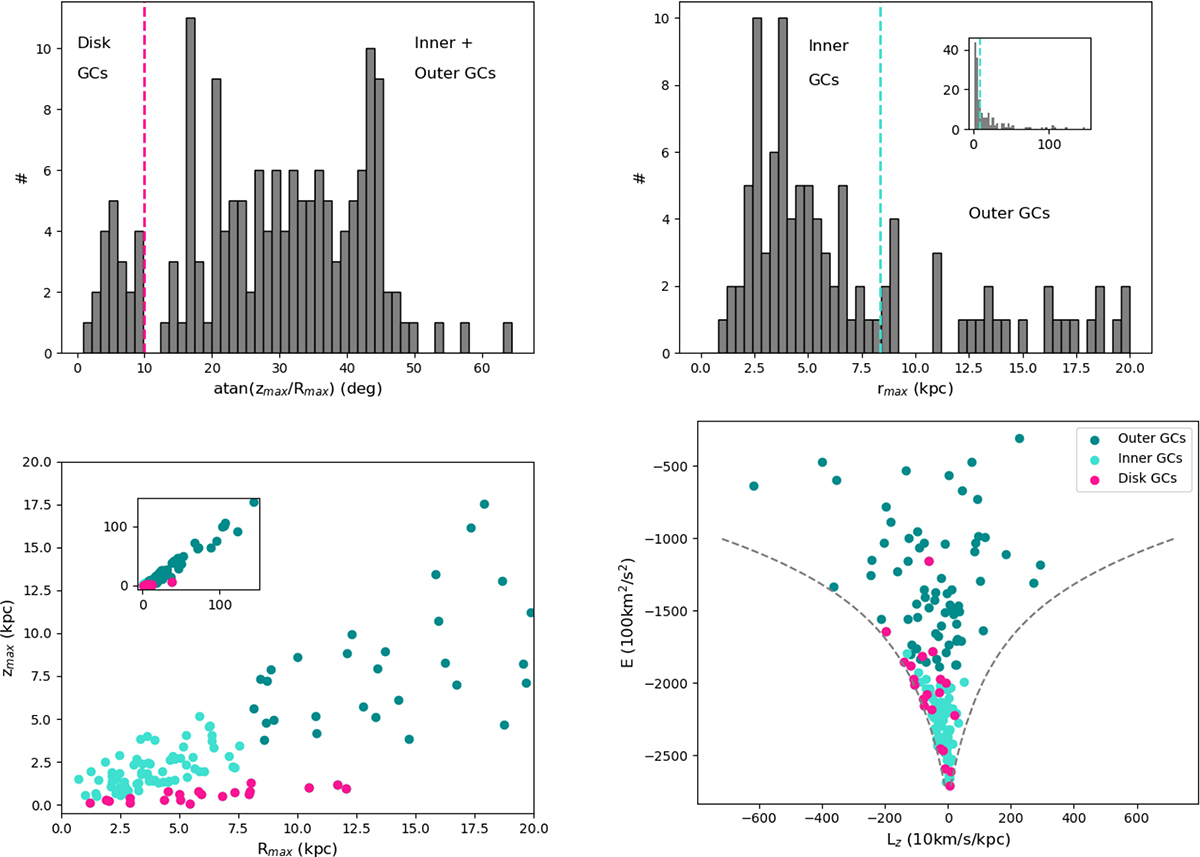
Fig. D.1.
Download original image
A series of plots describing the categorization of disk, inner, and outer globular clusters. From the top left to the bottom right: First panel: Distribution of the arctangent of the zmax/Rmax ratio for all simulated GCs. The values are expressed in degrees. The vertical dashed line at 10° separates disk clusters (arctan(zmax/Rmax) ≤10°) from the rest of the population of GCs. Second panel Distribution of the maximum 3D distance, rmax, from the Galactic center, reached by the GCs orbits in the last 5 Gyr. The main plot shows this distribution for rmax ≤ 20 kpc, where (as the inset shows) the whole distribution is extended at rmax > 100 kpc. In both panels, the vertical dashed line, at the solar radius r⊙, separates the group of inner GCs from the group of outer GCs. We note that the clusters in one of these two groups which also satisfy the criterion to be disk clusters are classified as disk GCs and are not in the inner or outer GC groups. Third panel: Distribution of disk GCs (magenta points), inner GCs (turquoise points), and outer GCs (dark turquoise points) in the Rmax − zmax plane. The main panel shows the distribution of the GCs having Rmax ≤ 20 kpc, the inset the distribution of the whole GC sample. Fourth panel: Distribution of the disk GCs (magenta points), inner GCs (turquoise points), and outer GCs (dark turquoise points) in the E − Lz plane. The dashed grey lines correspond, for any given energy E, to the angular momentum of the corresponding circular orbit. Prograde orbits correspond to negative Lz values, retrograde orbits to positive Lz.
Current usage metrics show cumulative count of Article Views (full-text article views including HTML views, PDF and ePub downloads, according to the available data) and Abstracts Views on Vision4Press platform.
Data correspond to usage on the plateform after 2015. The current usage metrics is available 48-96 hours after online publication and is updated daily on week days.
Initial download of the metrics may take a while.