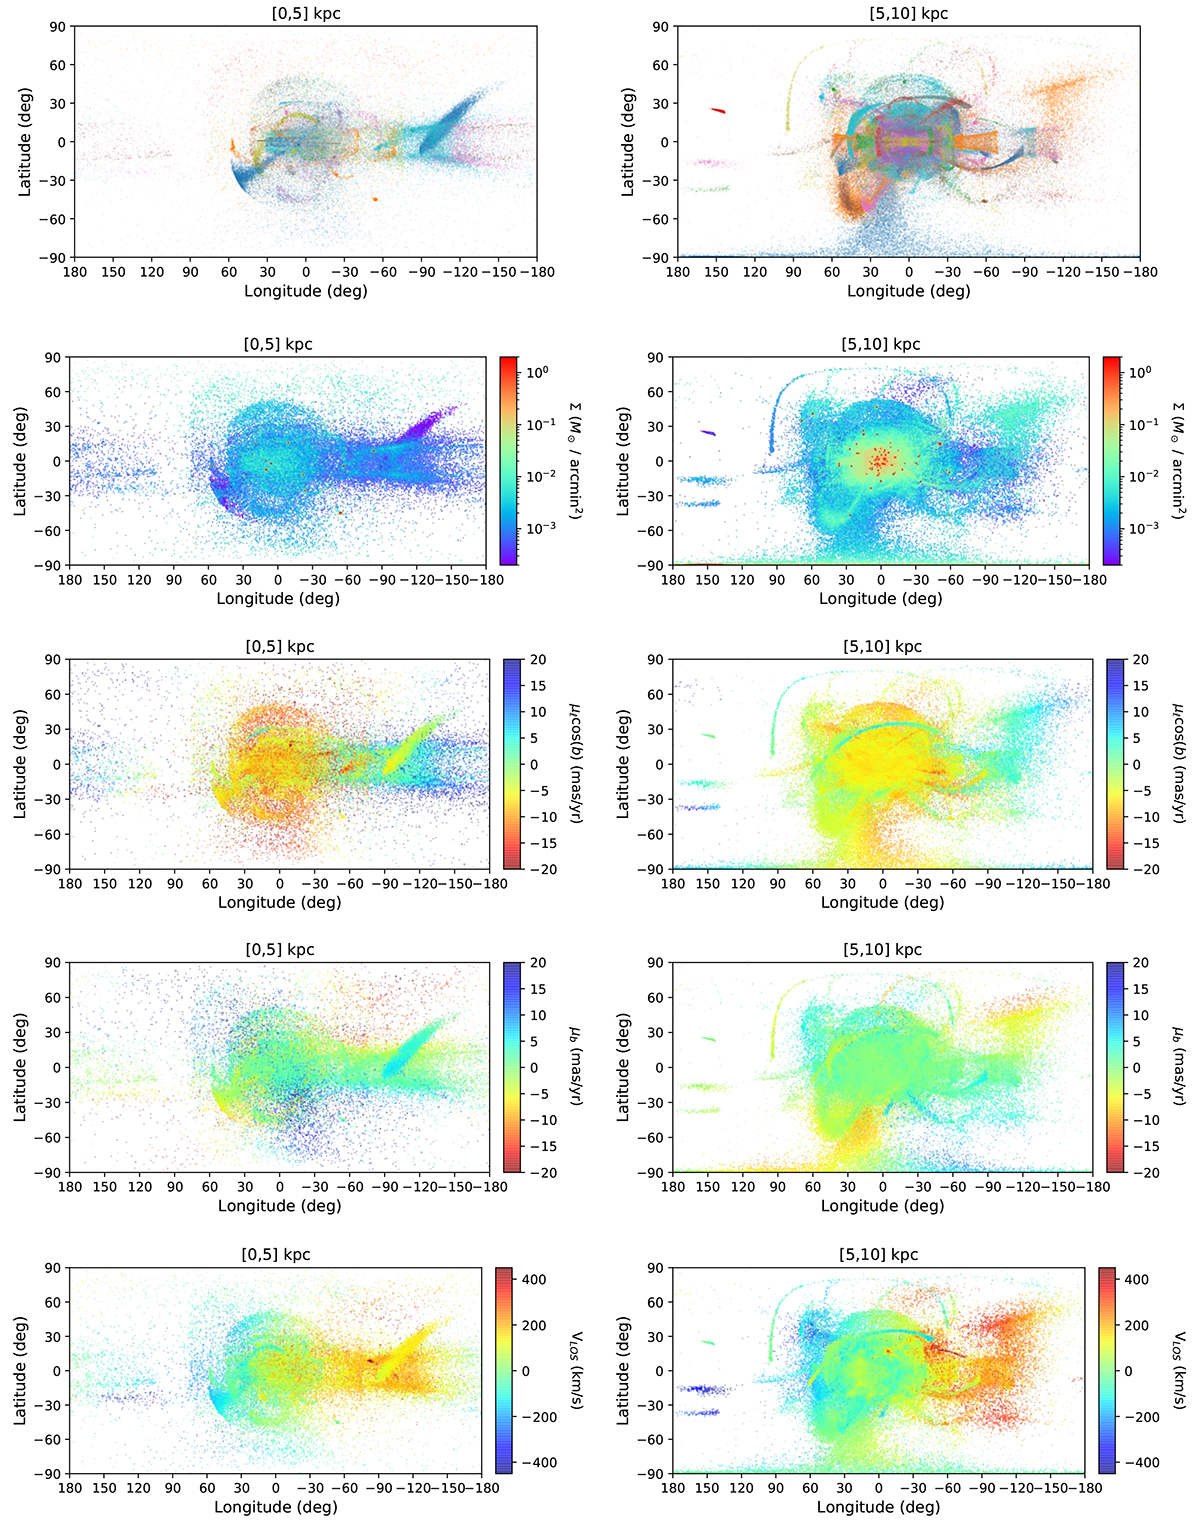
Fig. 2.
Download original image
Extra-tidal features colored and weighted by various quantities within limited distance bins from the Sun projected in the (ℓ,b) plane. All outputs arrise from using the PII galactic potential model and only the reference simulation is shown in order to preserve clairty. Left column: extra-tidal features found at a distance of [0, 5] kpc from the Sun. Top row: scatter plot, with different colors indicating different progenitor clusters. Second row: mass density map in logarithmic scale. Third row: map color-coated by proper motions in longitudinal direction. Fourth row: map color-coated by proper motions in latitudinal direction. Bottom row: map color-coded by line-of-sight velocities. Right column: same as left column, but for the tidal features found at a distance of [5, 10] kpc from the Sun. Note: the 10 colors used in the top panels are recycled between the 159 clusters, thus, all particles from the same cluster share one color, but a color is not unique to a cluster.
Current usage metrics show cumulative count of Article Views (full-text article views including HTML views, PDF and ePub downloads, according to the available data) and Abstracts Views on Vision4Press platform.
Data correspond to usage on the plateform after 2015. The current usage metrics is available 48-96 hours after online publication and is updated daily on week days.
Initial download of the metrics may take a while.