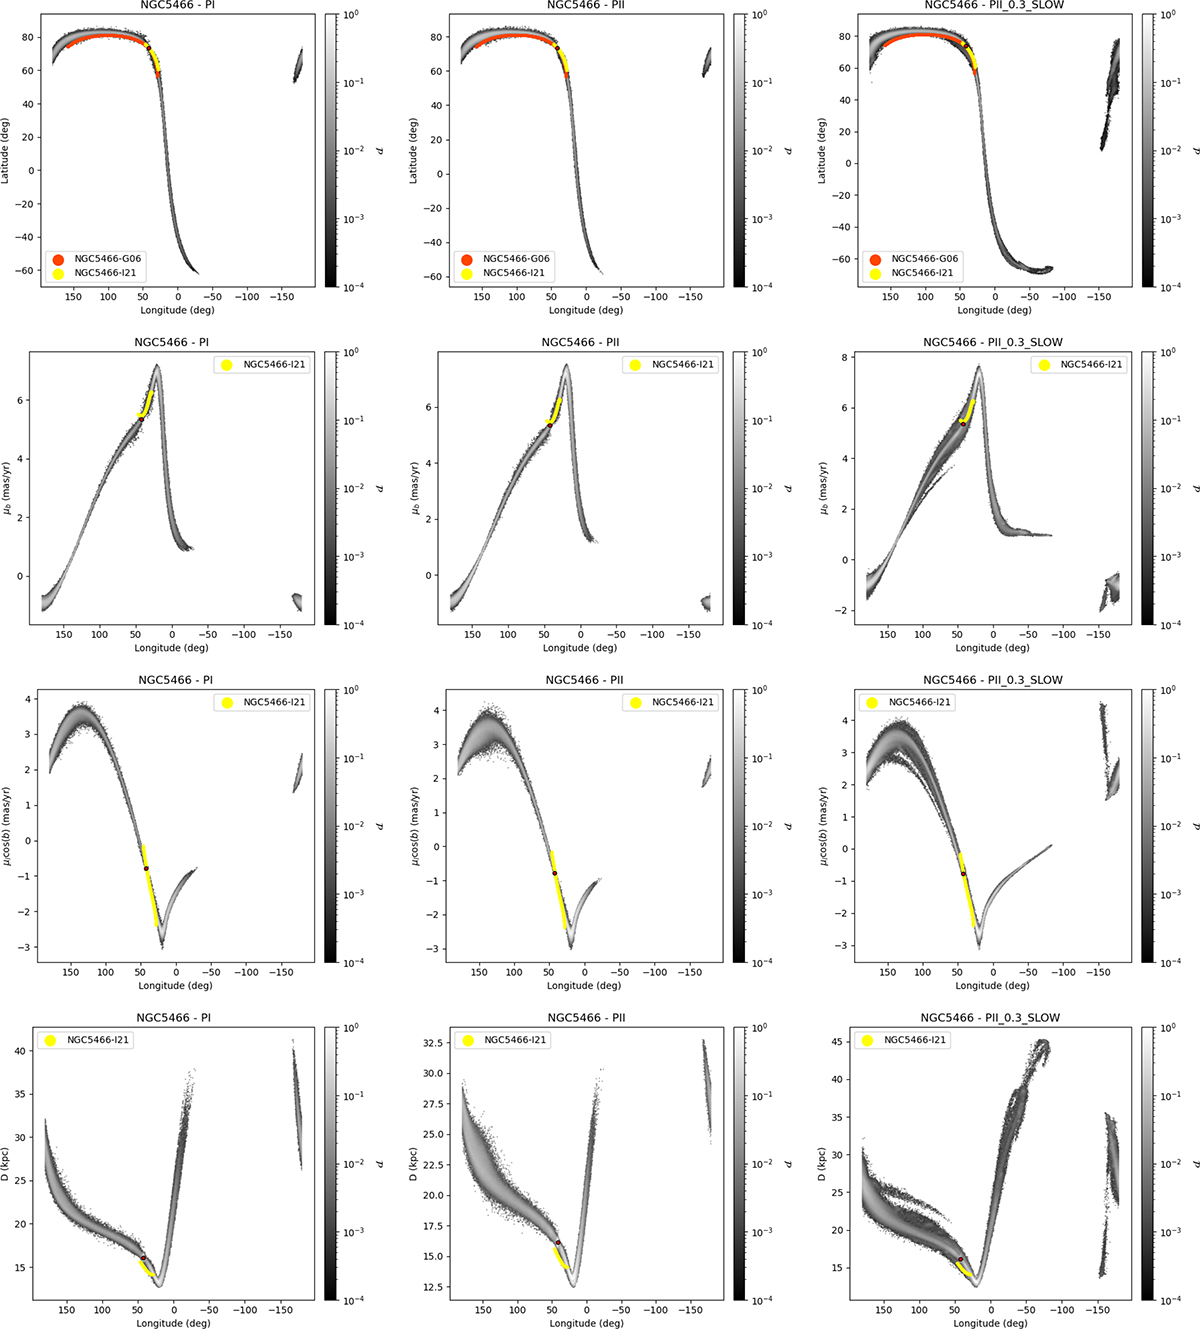
Fig. 12.
Download original image
Probability density maps arising from our simulations plotted against observed stellar streams as in Figs. 10 and 11, but for the case of the NGC 5466 cluster. Model predictions are compared to the tracks available in the galstreams library and those coming from the work by Grillmair & Johnson (2006, red lines) and Ibata et al. (2021, yellow lines). Note: proper motions and distances are available only for the NGC5466-I21 track. We also note that the variations in the streams, specifically the different stripes, originate from the errors considered in the simulations.
Current usage metrics show cumulative count of Article Views (full-text article views including HTML views, PDF and ePub downloads, according to the available data) and Abstracts Views on Vision4Press platform.
Data correspond to usage on the plateform after 2015. The current usage metrics is available 48-96 hours after online publication and is updated daily on week days.
Initial download of the metrics may take a while.