Fig. 10.

Download original image
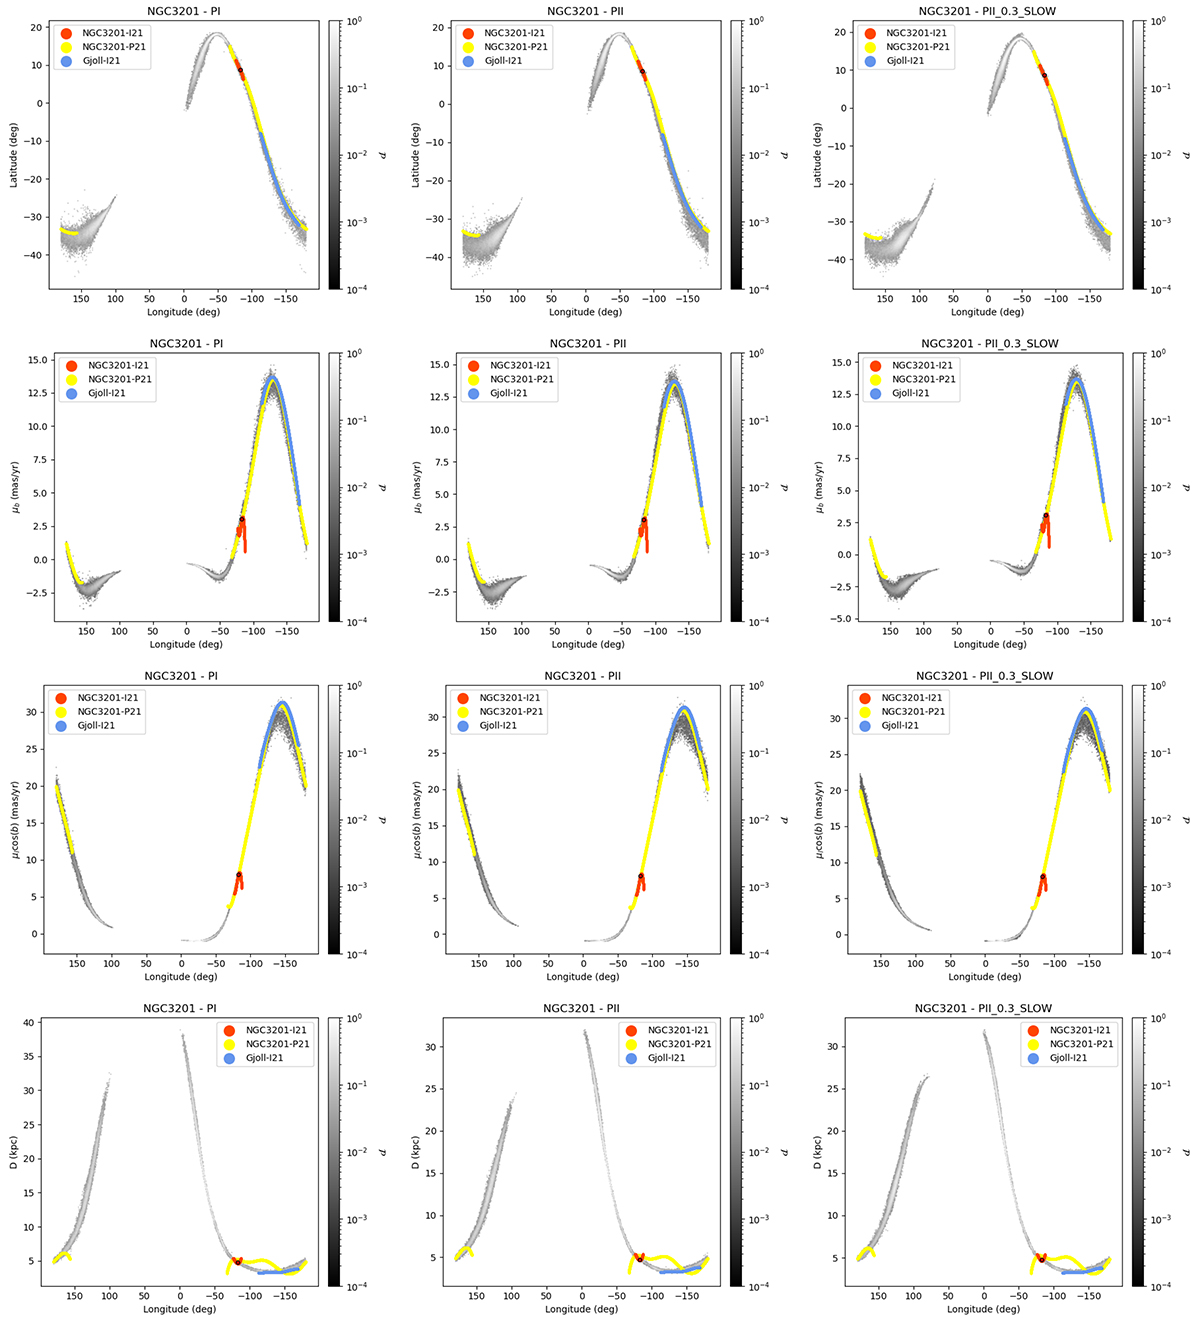
Projected density distribution of the NGC 3201 stream, as predicted by our simulations, in the (ℓ,b), (ℓ,μb), (ℓ,μℓ cos(b)) and (ℓ,D) planes, shown from top to bottom. The model predictions are shown for the three Galactic potentials PI (left column), PII (middle column), and PII-0.3-SLOW (right column) and are compared to the tracks available in the galstreams library for this cluster, and which are taken from Ibata et al. (2021, NGC3201-I21, red lines), Palau & Miralda-Escudé (2021, NGC3201-P21, yellow lines) and from Ibata et al. (2021), as for the Gjöll stream (Gjöll-I21, blue lines). For each panel, the color bar indicates the 2D probability density quantified by taking into account all the particles from the 51 realizations, which is then normalized to its maximum value. In all panels, the current position of the cluster is indicated by a red dot.
Current usage metrics show cumulative count of Article Views (full-text article views including HTML views, PDF and ePub downloads, according to the available data) and Abstracts Views on Vision4Press platform.
Data correspond to usage on the plateform after 2015. The current usage metrics is available 48-96 hours after online publication and is updated daily on week days.
Initial download of the metrics may take a while.


