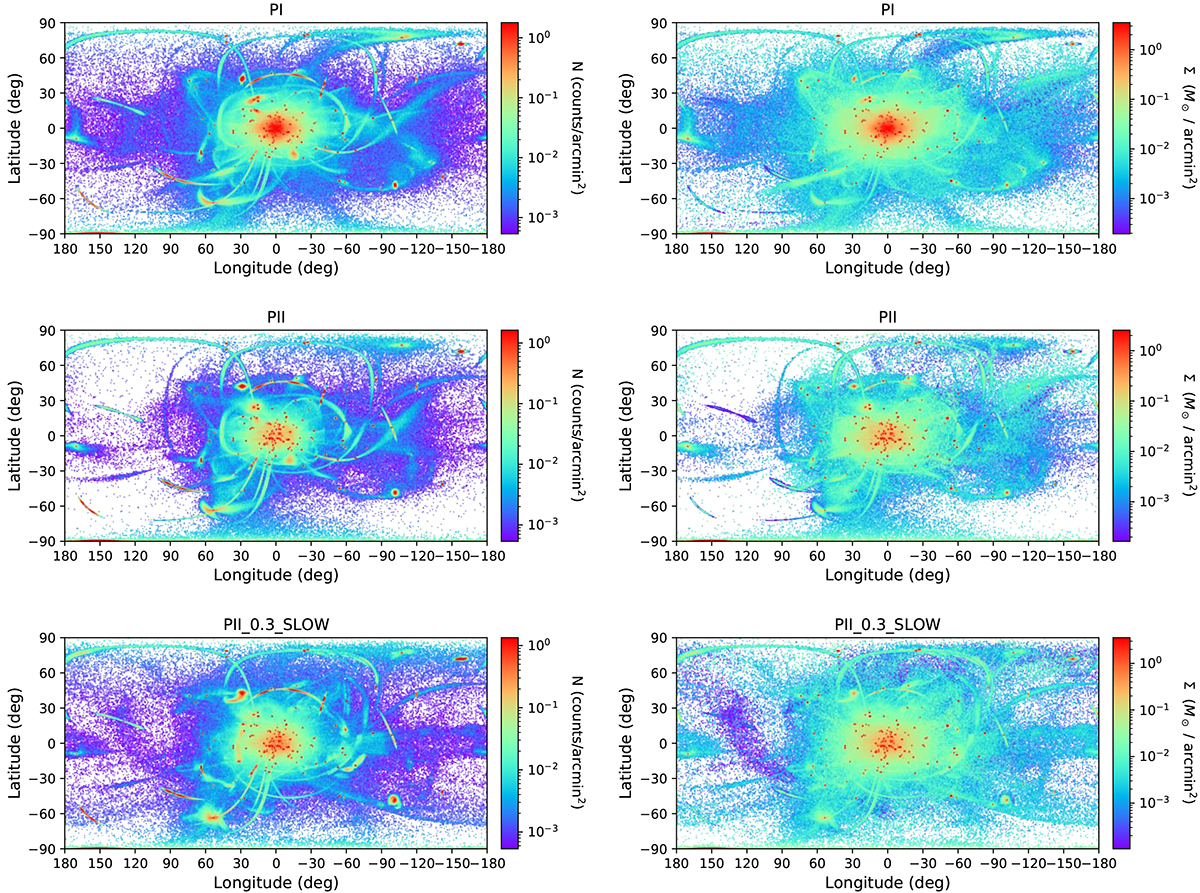
Fig. 1.
Download original image
Stellar surface density of the ensemble of extra-tidal features around the entire population of Galactic globular clusters at the current time, as predicted by our models. Left: surface number density. Right: surface mass density. Top row corresponds to model PI, the middle to model PII, and the bottom row to model PII-0.3-SLOW, as indicated. All densities are expressed in a logarithmic scale. The red point-like density maxima correspond to the current positions of the globular clusters. Values of higher density are overplotted. Thus in the case of mass density, diffuse tidal debris of more massive globular clusters covers the entire (ℓ,b) space and occults delicate tidal features, which are more visible when considering number density counts. In all panels, only the reference simulations are shown for clarity.
Current usage metrics show cumulative count of Article Views (full-text article views including HTML views, PDF and ePub downloads, according to the available data) and Abstracts Views on Vision4Press platform.
Data correspond to usage on the plateform after 2015. The current usage metrics is available 48-96 hours after online publication and is updated daily on week days.
Initial download of the metrics may take a while.