Fig. 5
Download original image
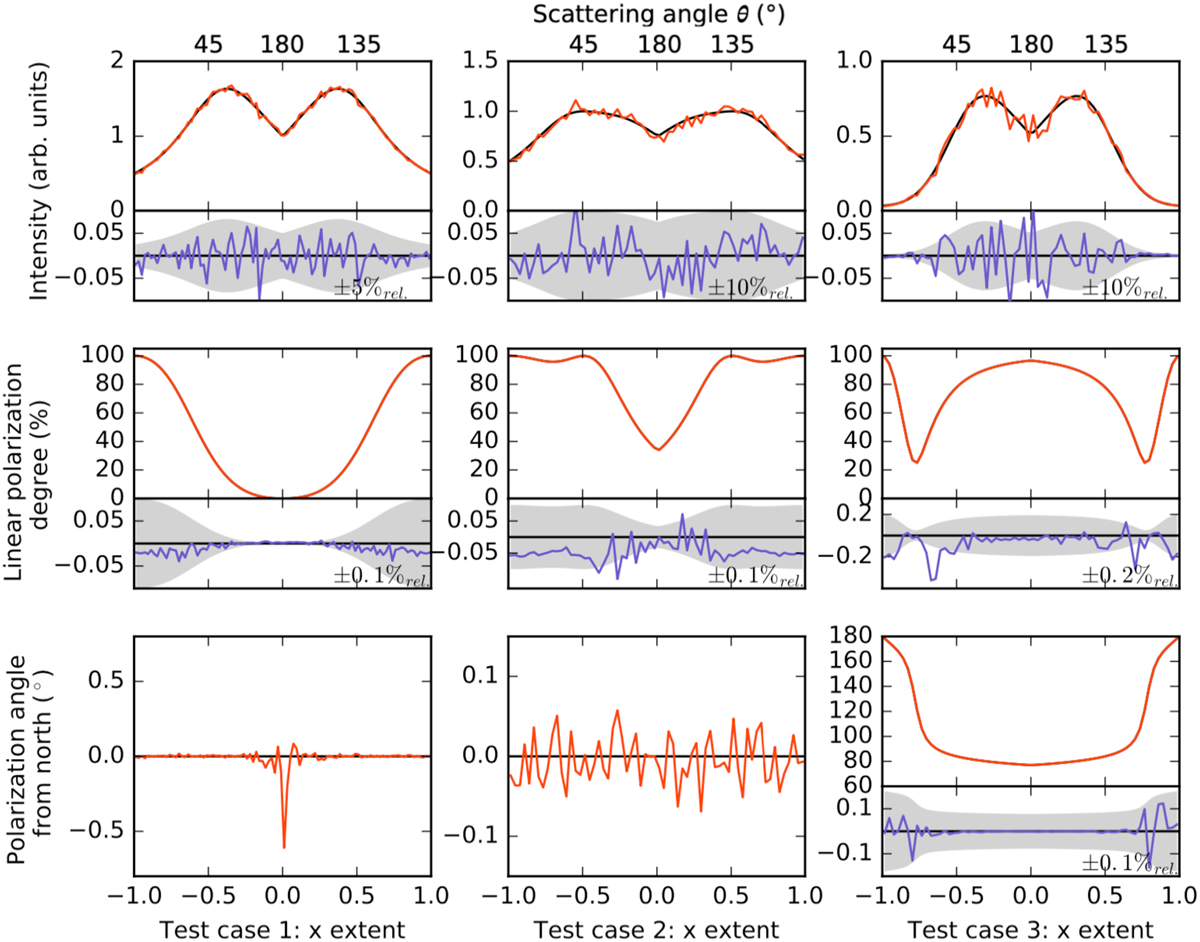
Test cases 1 through 3 using the spheroid-like Müller matrix (Eq. (46)) with the assumed particle orientation along the z-axis. The different rows show the intensity (top row), linear polarization degree (middle row), and polarization angle (bottom row) of the observed radiation. The analytical solution is shown in black and the model results in orange. The bottom panels present the absolute differences (blue) and relative differences (shaded area) between the analytic solution and the model. The magnitude of the shaded area is given in every panel.
Current usage metrics show cumulative count of Article Views (full-text article views including HTML views, PDF and ePub downloads, according to the available data) and Abstracts Views on Vision4Press platform.
Data correspond to usage on the plateform after 2015. The current usage metrics is available 48-96 hours after online publication and is updated daily on week days.
Initial download of the metrics may take a while.