Fig. 3
Download original image
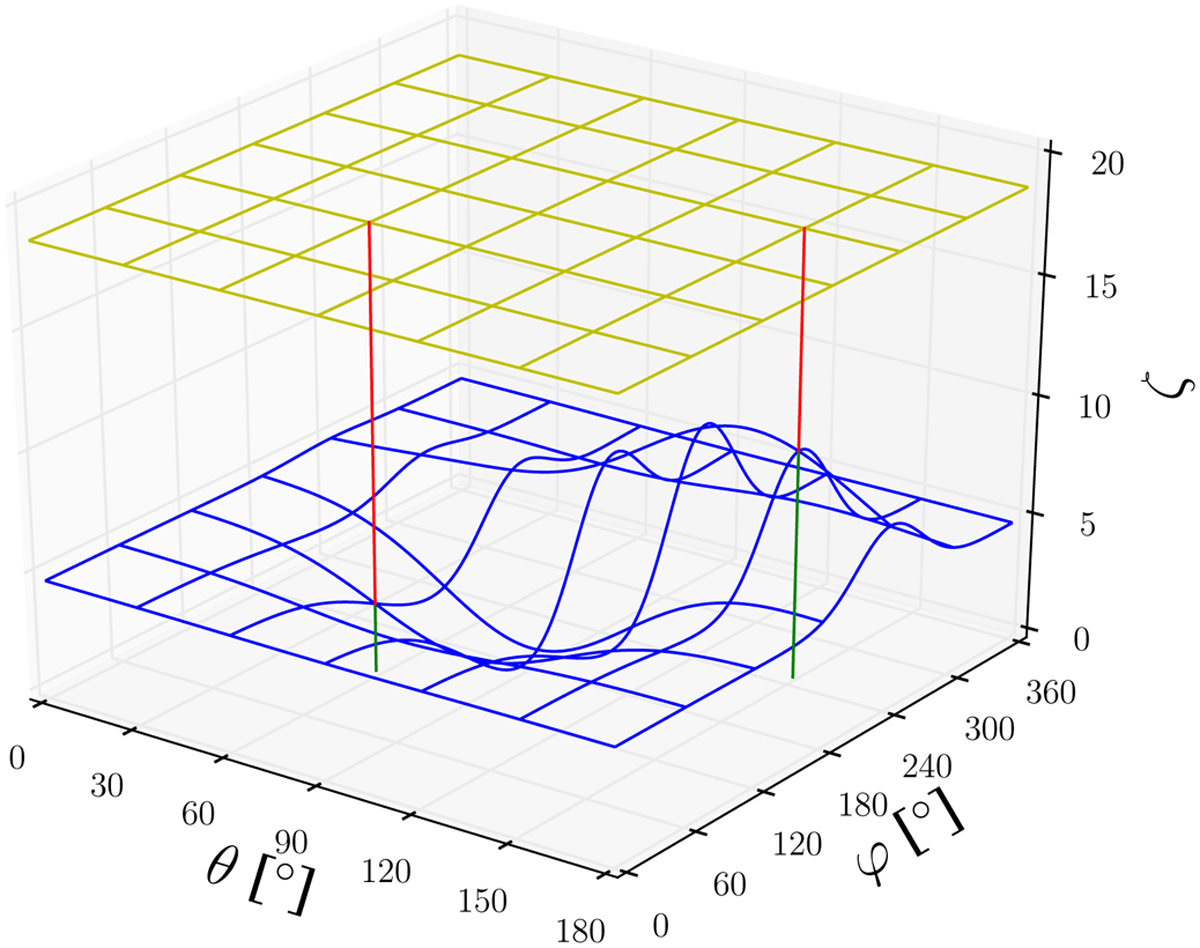
Visualization of the rejection sampling method. An arbitrary probability density function P(θ, φ) is shown in blue, and the ceiling value υcei1 is in yellow. An angle pair (θ, φ) is accepted if a third (0, υcei1) is smaller than P(θ, φ). For two-angle pairs, the segments in green and red visualize the ζ value leading to acceptance or rejection, respectively. The case where the green line is longer has a higher chance of being selected than the other case where the green line is shorter. For the selected case of the longer green line, P(θ, φ) becomes much larger than in the other case, as is expected.
Current usage metrics show cumulative count of Article Views (full-text article views including HTML views, PDF and ePub downloads, according to the available data) and Abstracts Views on Vision4Press platform.
Data correspond to usage on the plateform after 2015. The current usage metrics is available 48-96 hours after online publication and is updated daily on week days.
Initial download of the metrics may take a while.