Fig. 7
Download original image
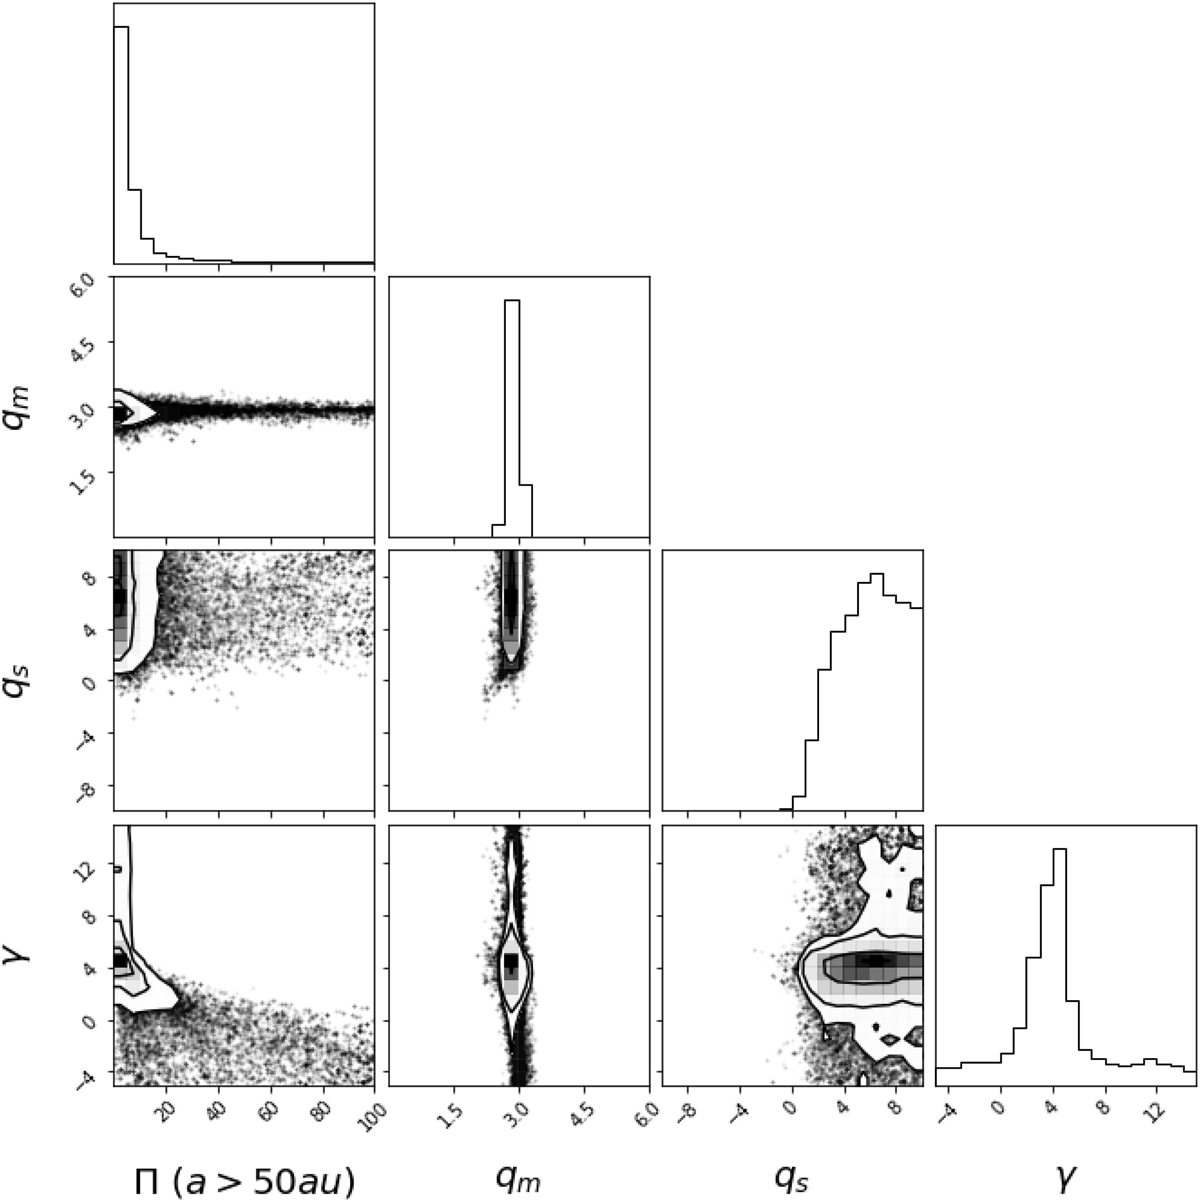
Corner plot of the results of the MCMC search of the viable parameter space. The contour plots show the correlations between parameters, and the histograms show the one-parameter distribution within the model evaluation. The best-fit values of the model parameters are ![]() ,
, ![]() ,
, ![]() , and
, and ![]() , where qs can probably be increased to arbitrarily high values and remain a good fit. qm is strongly constrained, while the other parameters have significant areas in which the fit quality is lower that are not strongly excluded.
, where qs can probably be increased to arbitrarily high values and remain a good fit. qm is strongly constrained, while the other parameters have significant areas in which the fit quality is lower that are not strongly excluded.
Current usage metrics show cumulative count of Article Views (full-text article views including HTML views, PDF and ePub downloads, according to the available data) and Abstracts Views on Vision4Press platform.
Data correspond to usage on the plateform after 2015. The current usage metrics is available 48-96 hours after online publication and is updated daily on week days.
Initial download of the metrics may take a while.