Fig. 5.
Download original image
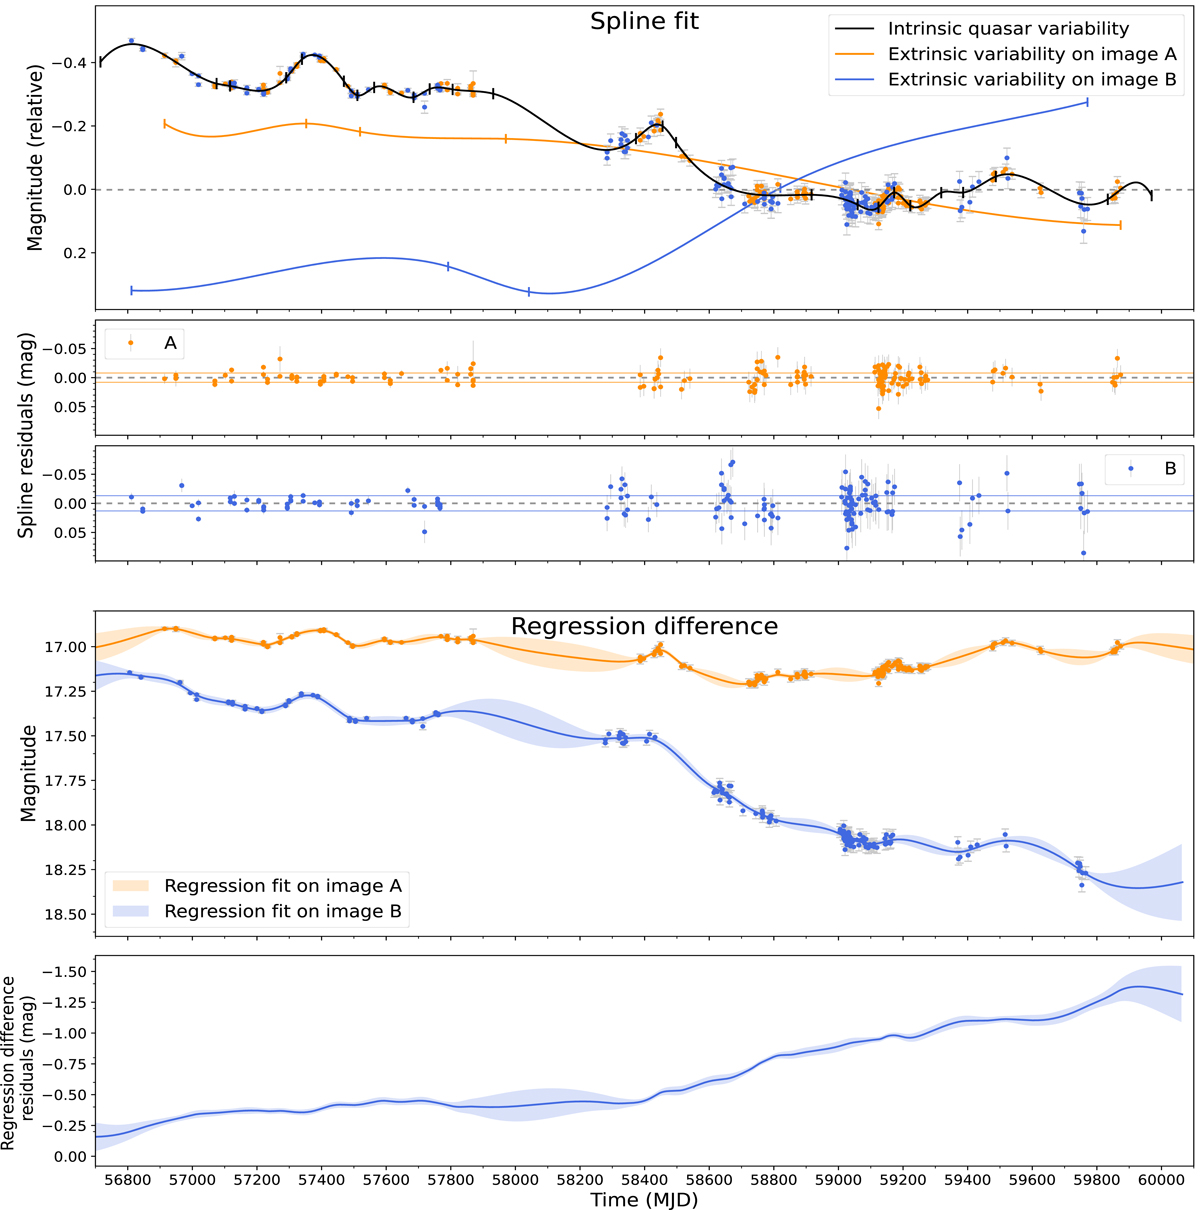
PyCS3 fitting of the Gaia + ZTF light curve. Top panels: spline fit and residuals of the eRASS1 J050129.5−073309 data. The solid black curve corresponds to the intrinsic variability of the quasar shared by the lensed images. The solid orange and blue lines show the extrinsic variation produced by microlensing affecting images A and B, respectively. The light curve is fitted with spline functions with η = 125 and ηml = 500 days. Bottom panels: regression difference fit of the light curves and the corresponding 1σ errors. The bottom panel shows the difference between the best fit of image A and the best fit of the time-shifted image B, evidencing microlensing effects. In the top four panels, the light curves of image B (blue data points) are shifted by the optimal time delay found with the corresponding method. For the case of the spline fitting, we apply a shift of −94 days, and for the regression difference method a shift of −108 days. The data points for image A (orange) are plotted without a time shift.
Current usage metrics show cumulative count of Article Views (full-text article views including HTML views, PDF and ePub downloads, according to the available data) and Abstracts Views on Vision4Press platform.
Data correspond to usage on the plateform after 2015. The current usage metrics is available 48-96 hours after online publication and is updated daily on week days.
Initial download of the metrics may take a while.