Open Access
Fig. 3.
Download original image
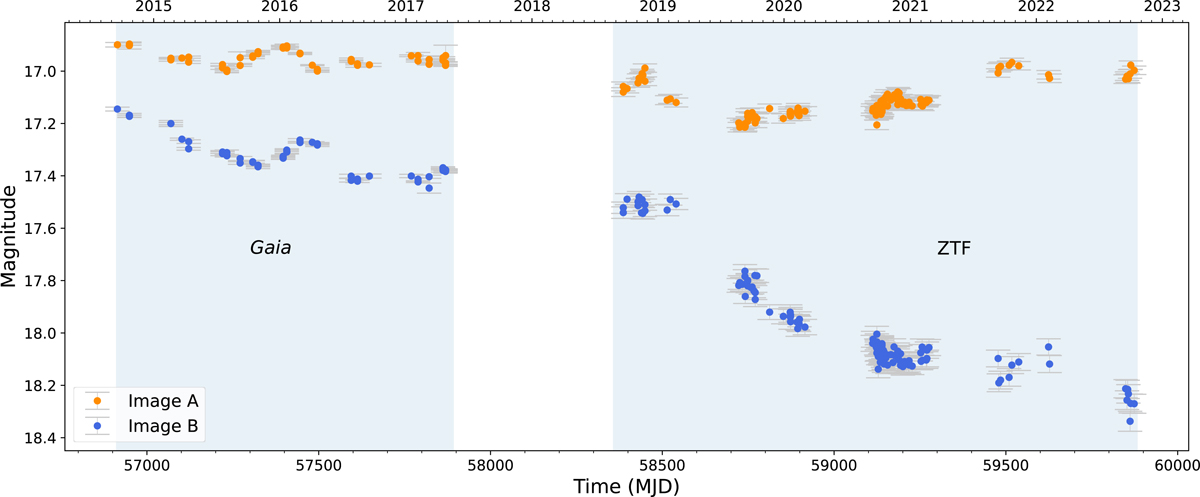
Gaia DR3 and ZTF g-band light curves for eRASS1 J050129.5−073309. The orange and blue circles correspond to image A and image B, respectively. The Gaia data cover the epoch from September 2014 to April 2017 and the ZTF data the epoch from October 2018 to August 2022.
Current usage metrics show cumulative count of Article Views (full-text article views including HTML views, PDF and ePub downloads, according to the available data) and Abstracts Views on Vision4Press platform.
Data correspond to usage on the plateform after 2015. The current usage metrics is available 48-96 hours after online publication and is updated daily on week days.
Initial download of the metrics may take a while.