Fig. 1.
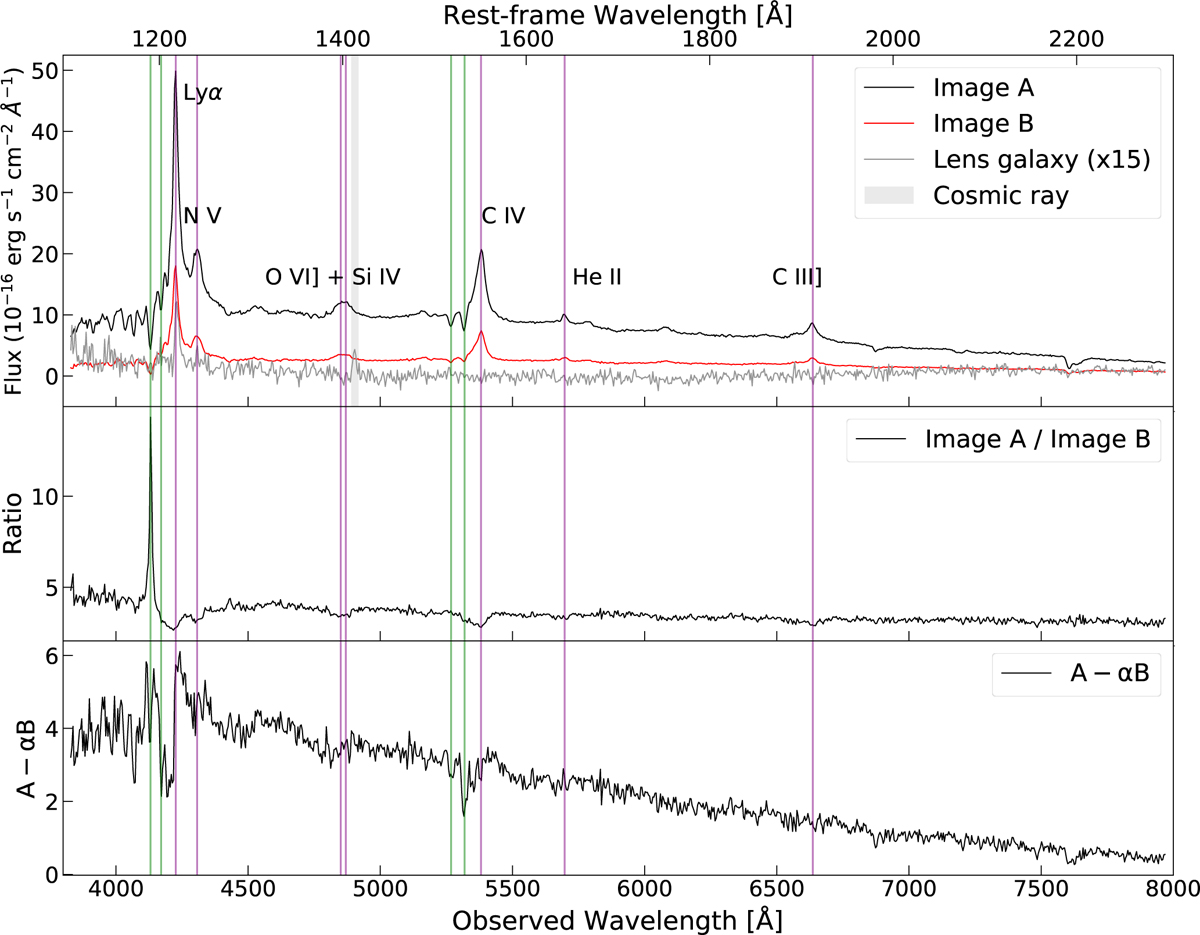
Download original image
NTT/EFOSC2 optical spectra of the two components of the lensed quasar eRASS1 J050129.5−073309. Top panel: black and red curves correspond to image A and image B of the doubly lensed quasar. The gray curve corresponds to the central Moffat profile fitting of the 2D spectrum. The flux of this spectrum is increased by a factor of 15 for visualization purposes. We show observed and rest-frame wavelengths to illustrate the redshift of the source. We annotate the main emission lines recognized in the spectra. Middle panel: ratio between the spectra from image A and image B. Bottom panel: subtraction of scaled spectrum B from spectrum A using a scaling factor of α = 2.4 (see Sect. 3.1 for more details). The vertical purple and green lines highlight the main emission and absorption lines, respectively. The velocities of the absorption features are −3460 km s−1 and −6320 km s−1 with respect to z = 2.47.
Current usage metrics show cumulative count of Article Views (full-text article views including HTML views, PDF and ePub downloads, according to the available data) and Abstracts Views on Vision4Press platform.
Data correspond to usage on the plateform after 2015. The current usage metrics is available 48-96 hours after online publication and is updated daily on week days.
Initial download of the metrics may take a while.