Open Access
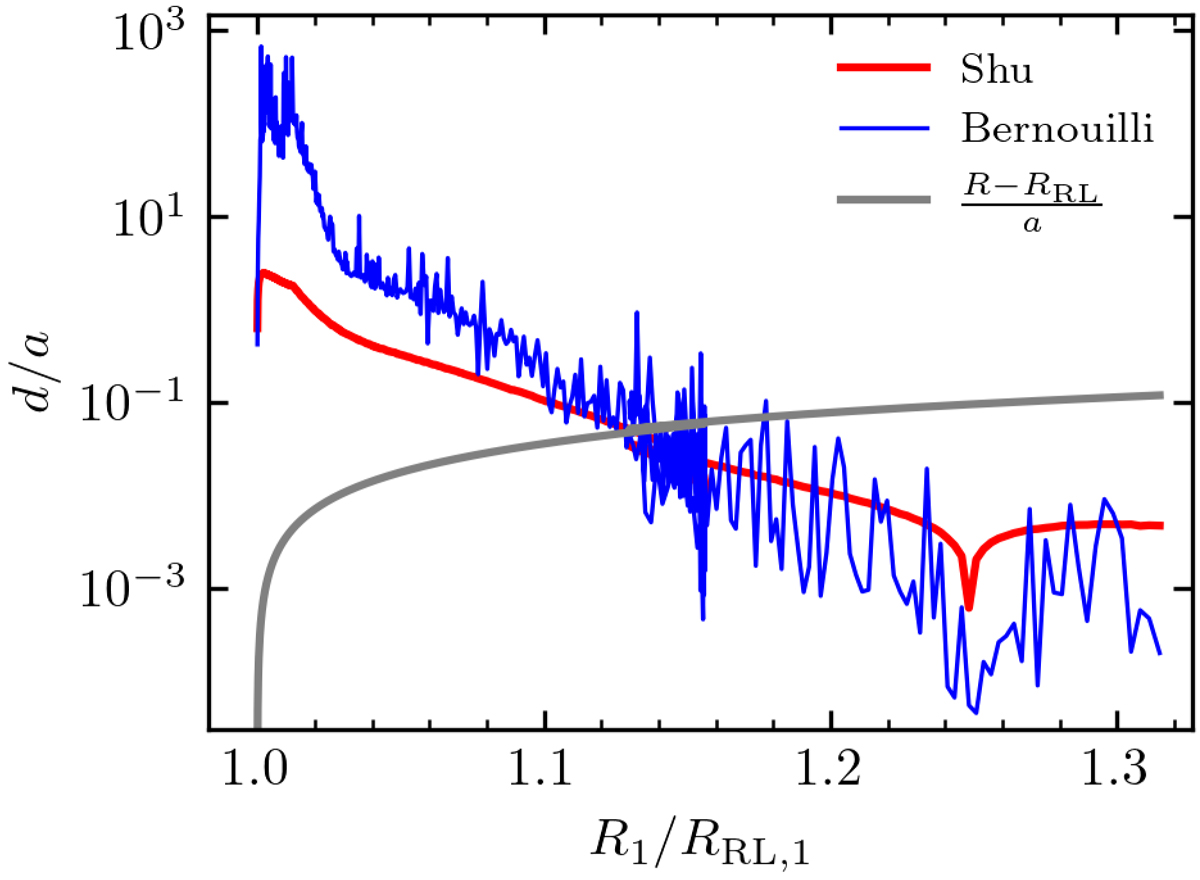
Fig. 5.
Download original image
Thickness of the ET layer, d, with respect to the binary separation a as function of the radius of the primary star during the long lived contact phase. The gray line gives the physical size of the overflowing layers, and corresponds to the maximal width the ET layer can assume.
Current usage metrics show cumulative count of Article Views (full-text article views including HTML views, PDF and ePub downloads, according to the available data) and Abstracts Views on Vision4Press platform.
Data correspond to usage on the plateform after 2015. The current usage metrics is available 48-96 hours after online publication and is updated daily on week days.
Initial download of the metrics may take a while.