Fig. 4.
Download original image
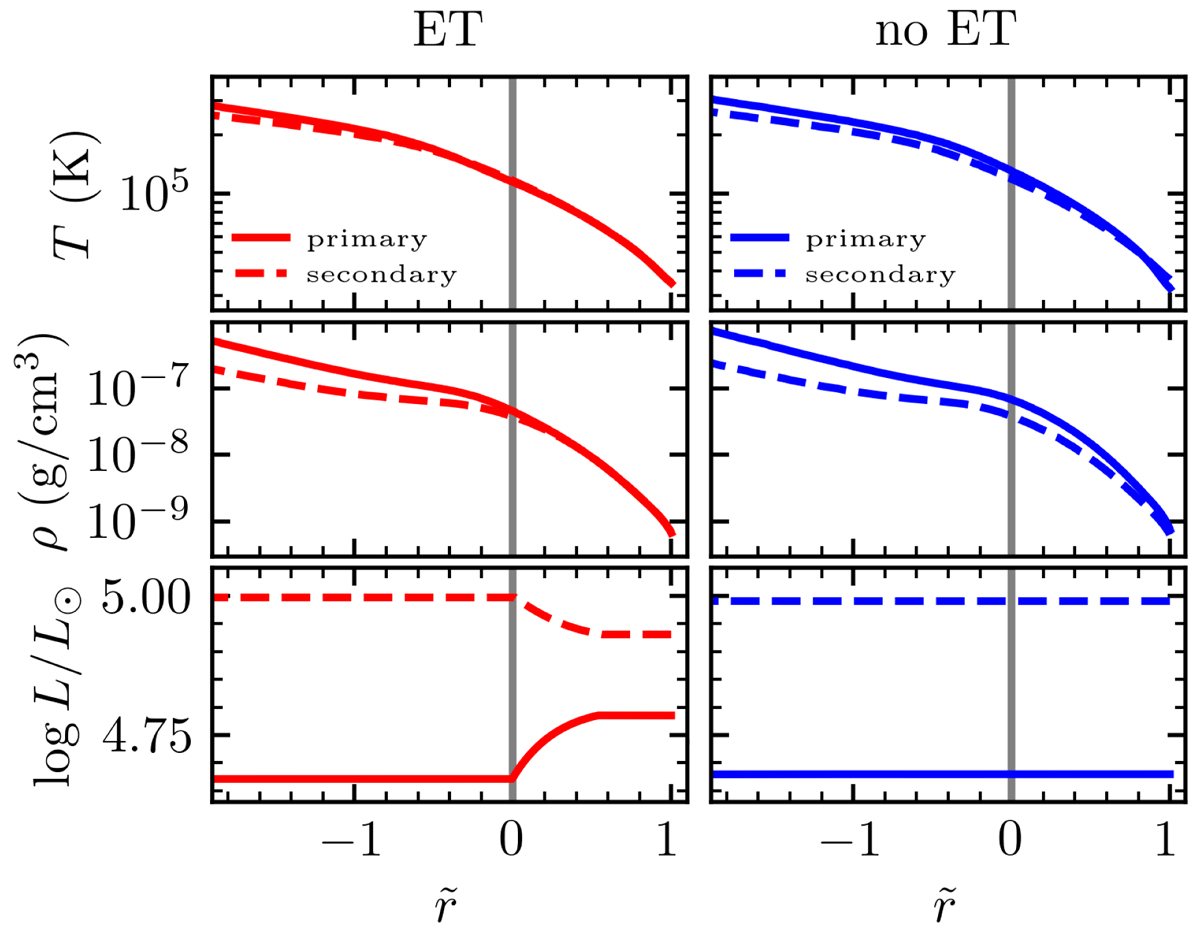
Profiles of outer layers of the binary components at the onset of inverse MT. It shows (top to bottom) the temperature, density, and luminosity profiles for both components in the ET (red, left column) and no ET (blue, right column) cases, all as function of the scaled radius coordinate ![]() . The gray vertical lines show the location of the RL.
. The gray vertical lines show the location of the RL.
Current usage metrics show cumulative count of Article Views (full-text article views including HTML views, PDF and ePub downloads, according to the available data) and Abstracts Views on Vision4Press platform.
Data correspond to usage on the plateform after 2015. The current usage metrics is available 48-96 hours after online publication and is updated daily on week days.
Initial download of the metrics may take a while.