Open Access
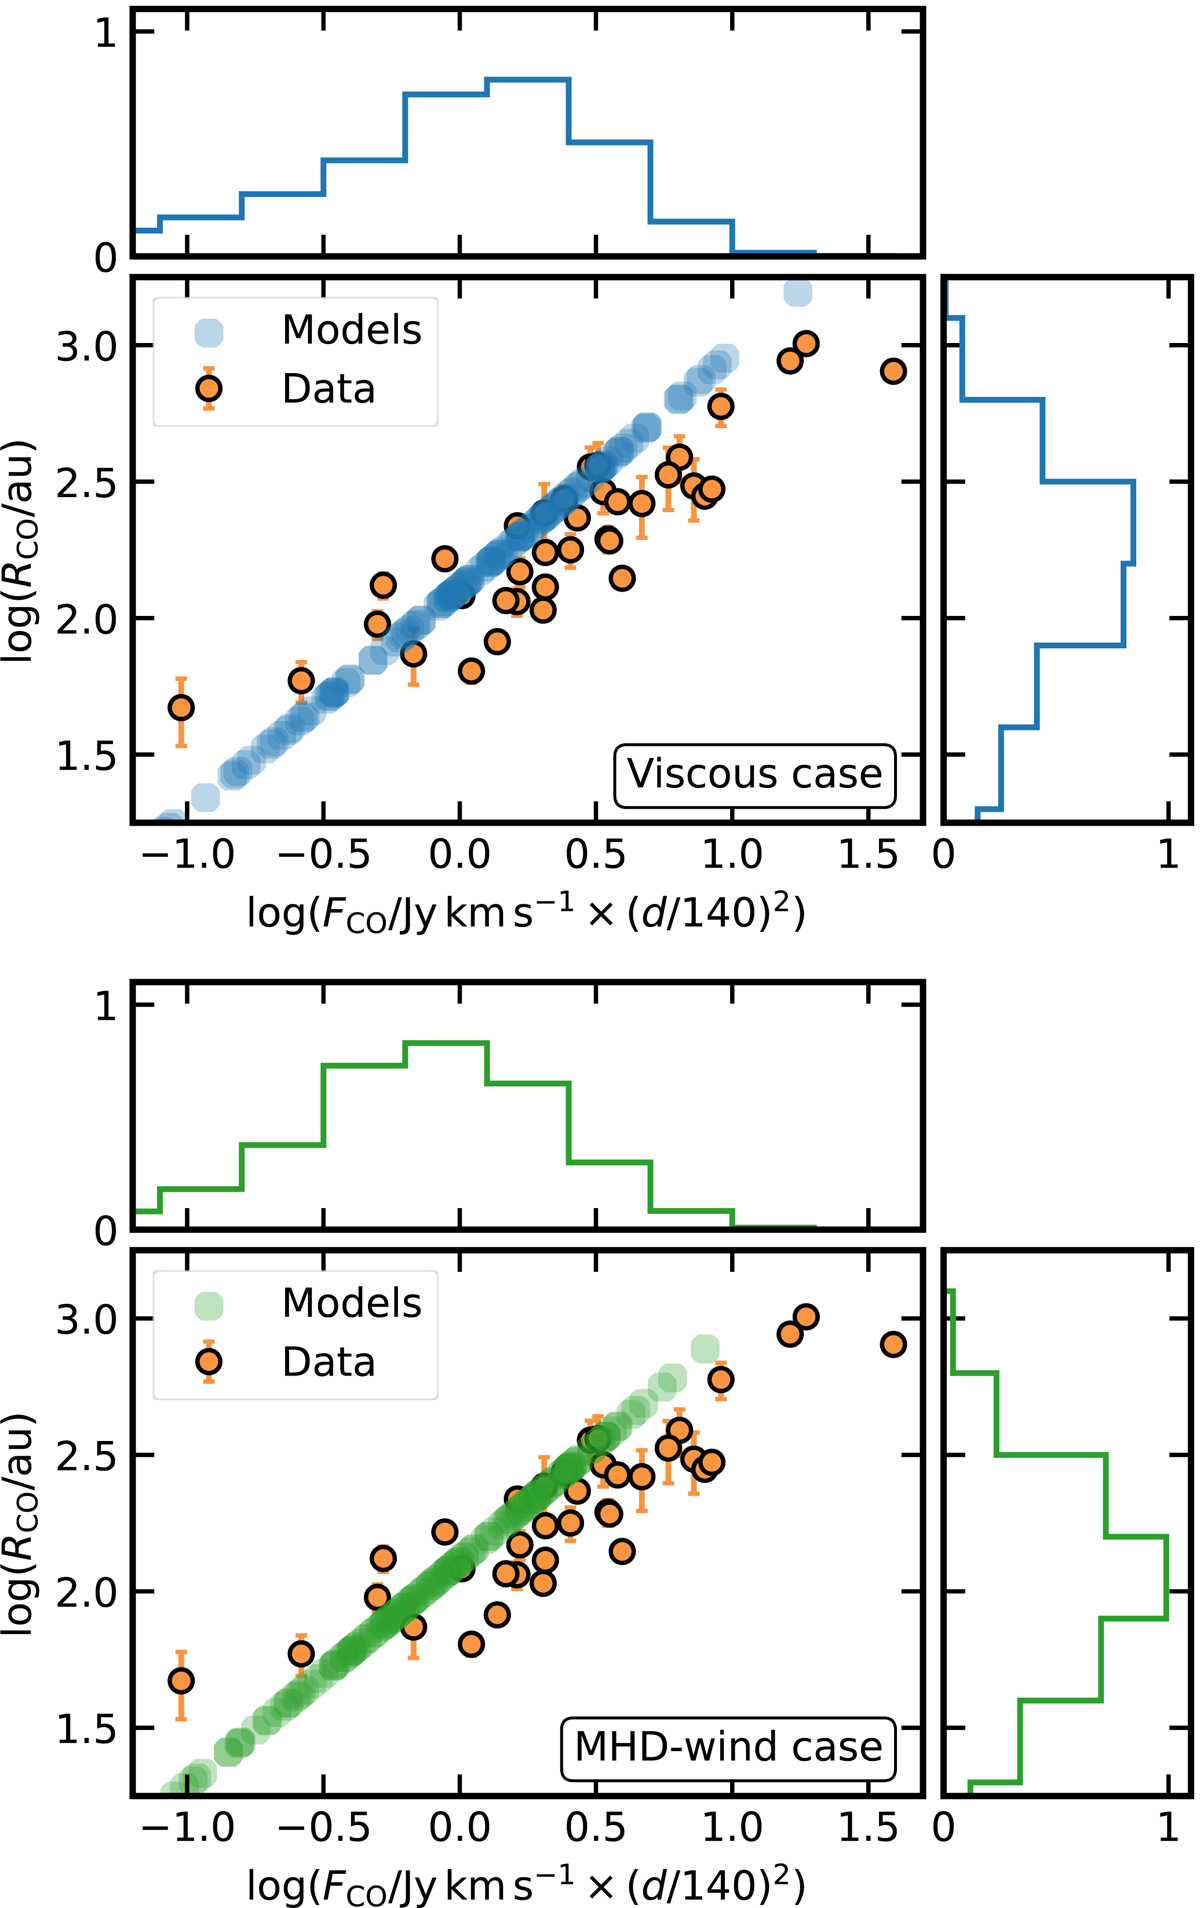
Fig. D.1.
Download original image
CO size–luminosity correlation. Data are plotted as orange dots and models as blue (viscous case, upper panel) and green (MHD-wind case, bottom panel) dots. Both models can reproduce the correlation slope and roughly its normalisation.
Current usage metrics show cumulative count of Article Views (full-text article views including HTML views, PDF and ePub downloads, according to the available data) and Abstracts Views on Vision4Press platform.
Data correspond to usage on the plateform after 2015. The current usage metrics is available 48-96 hours after online publication and is updated daily on week days.
Initial download of the metrics may take a while.