Fig. 2.
Download original image
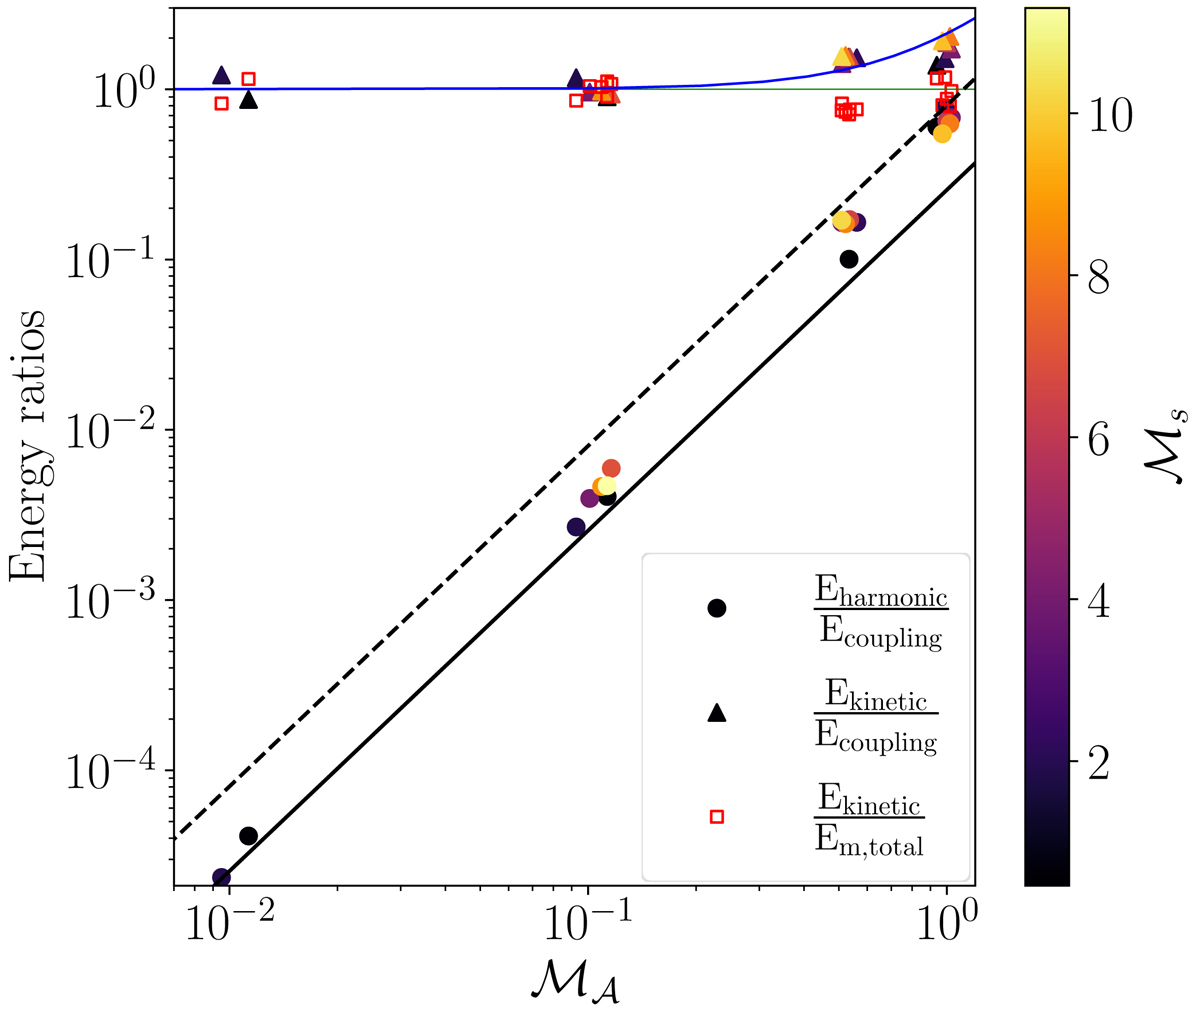
Comparison between analytical and numerical results. The solid and dashed thick black lines correspond to the Eharmonic/Ecoupling ratio obtained analytically for ℳA → 0 (ζ = 0) and ℳA → 1 (![]() ), respectively. Numerical data are shown with colored dots. The blue line corresponds to the analytically obtained Ekinetic/Ecoupling ratio, while colored triangles show the same quantities calculated from numerical data. The red boxes correspond to Ekinetic/Em, total. The thin green line shows the energy terms in equipartition. The color bar shows the sonic Mach number (ℳs) of the simulations.
), respectively. Numerical data are shown with colored dots. The blue line corresponds to the analytically obtained Ekinetic/Ecoupling ratio, while colored triangles show the same quantities calculated from numerical data. The red boxes correspond to Ekinetic/Em, total. The thin green line shows the energy terms in equipartition. The color bar shows the sonic Mach number (ℳs) of the simulations.
Current usage metrics show cumulative count of Article Views (full-text article views including HTML views, PDF and ePub downloads, according to the available data) and Abstracts Views on Vision4Press platform.
Data correspond to usage on the plateform after 2015. The current usage metrics is available 48-96 hours after online publication and is updated daily on week days.
Initial download of the metrics may take a while.