Fig. 3.
Download original image
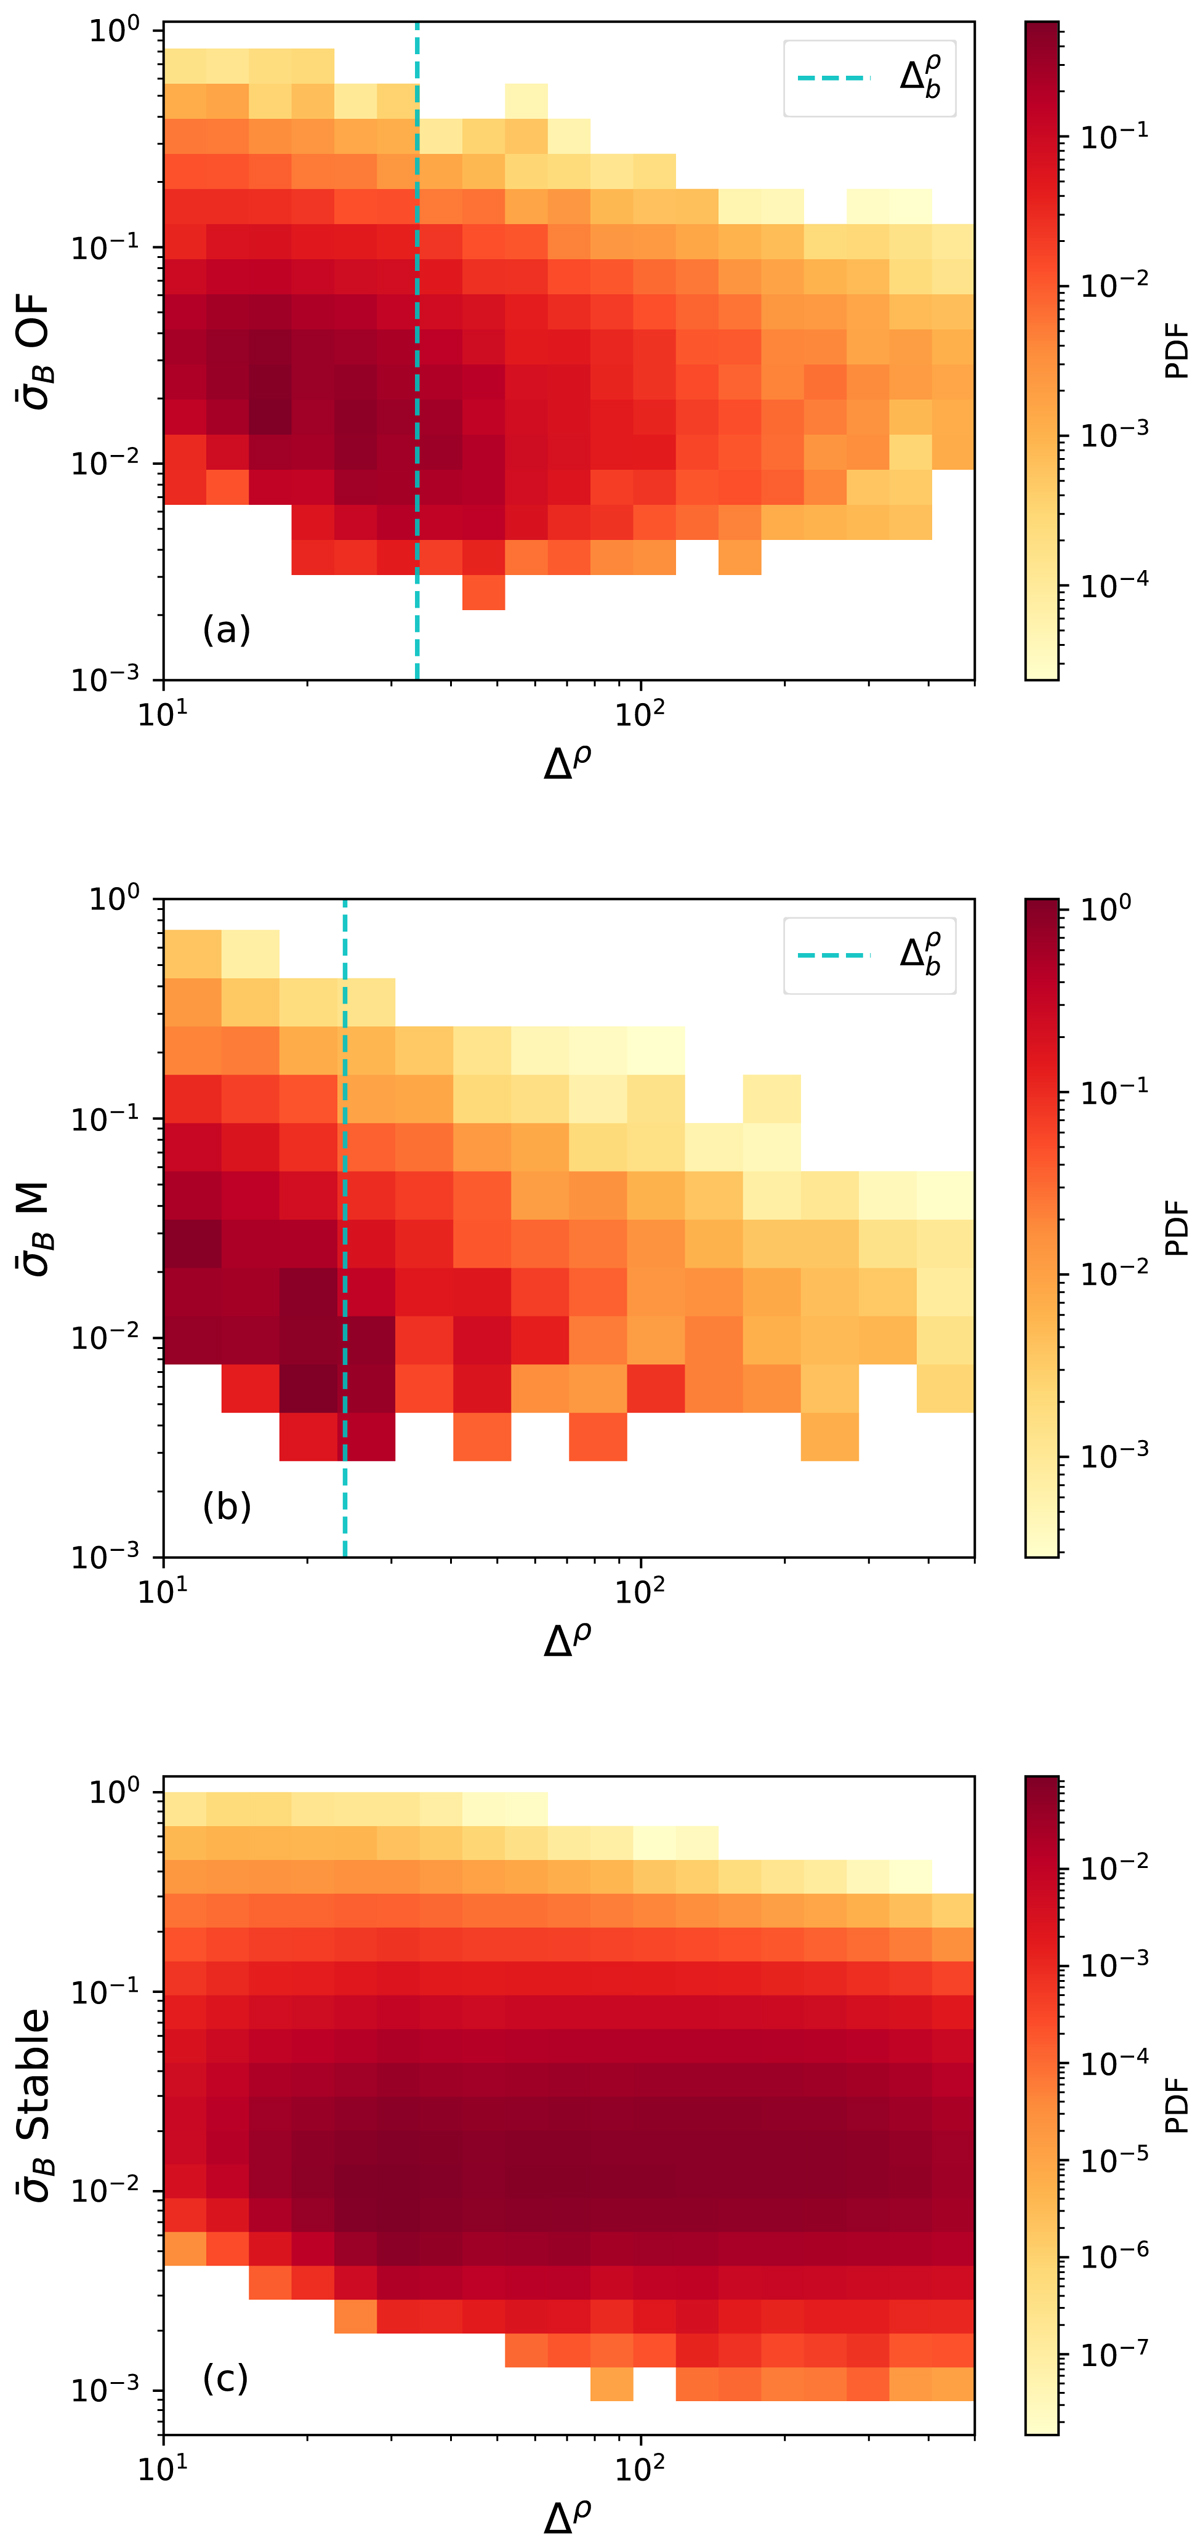
PDF of data in ![]() –Δρ parameter space for (a) oblique fire-hose unstable and (b) mirror-mode unstable data distributions. Panel (c) shows the same PDF for equivalent persistence intervals sampled from the stable data. The vertical lines shown in (a) and (b) denote the breakpoints previously identified by Opie et al. (2022).
–Δρ parameter space for (a) oblique fire-hose unstable and (b) mirror-mode unstable data distributions. Panel (c) shows the same PDF for equivalent persistence intervals sampled from the stable data. The vertical lines shown in (a) and (b) denote the breakpoints previously identified by Opie et al. (2022).
Current usage metrics show cumulative count of Article Views (full-text article views including HTML views, PDF and ePub downloads, according to the available data) and Abstracts Views on Vision4Press platform.
Data correspond to usage on the plateform after 2015. The current usage metrics is available 48-96 hours after online publication and is updated daily on week days.
Initial download of the metrics may take a while.