Fig. 1.
Download original image
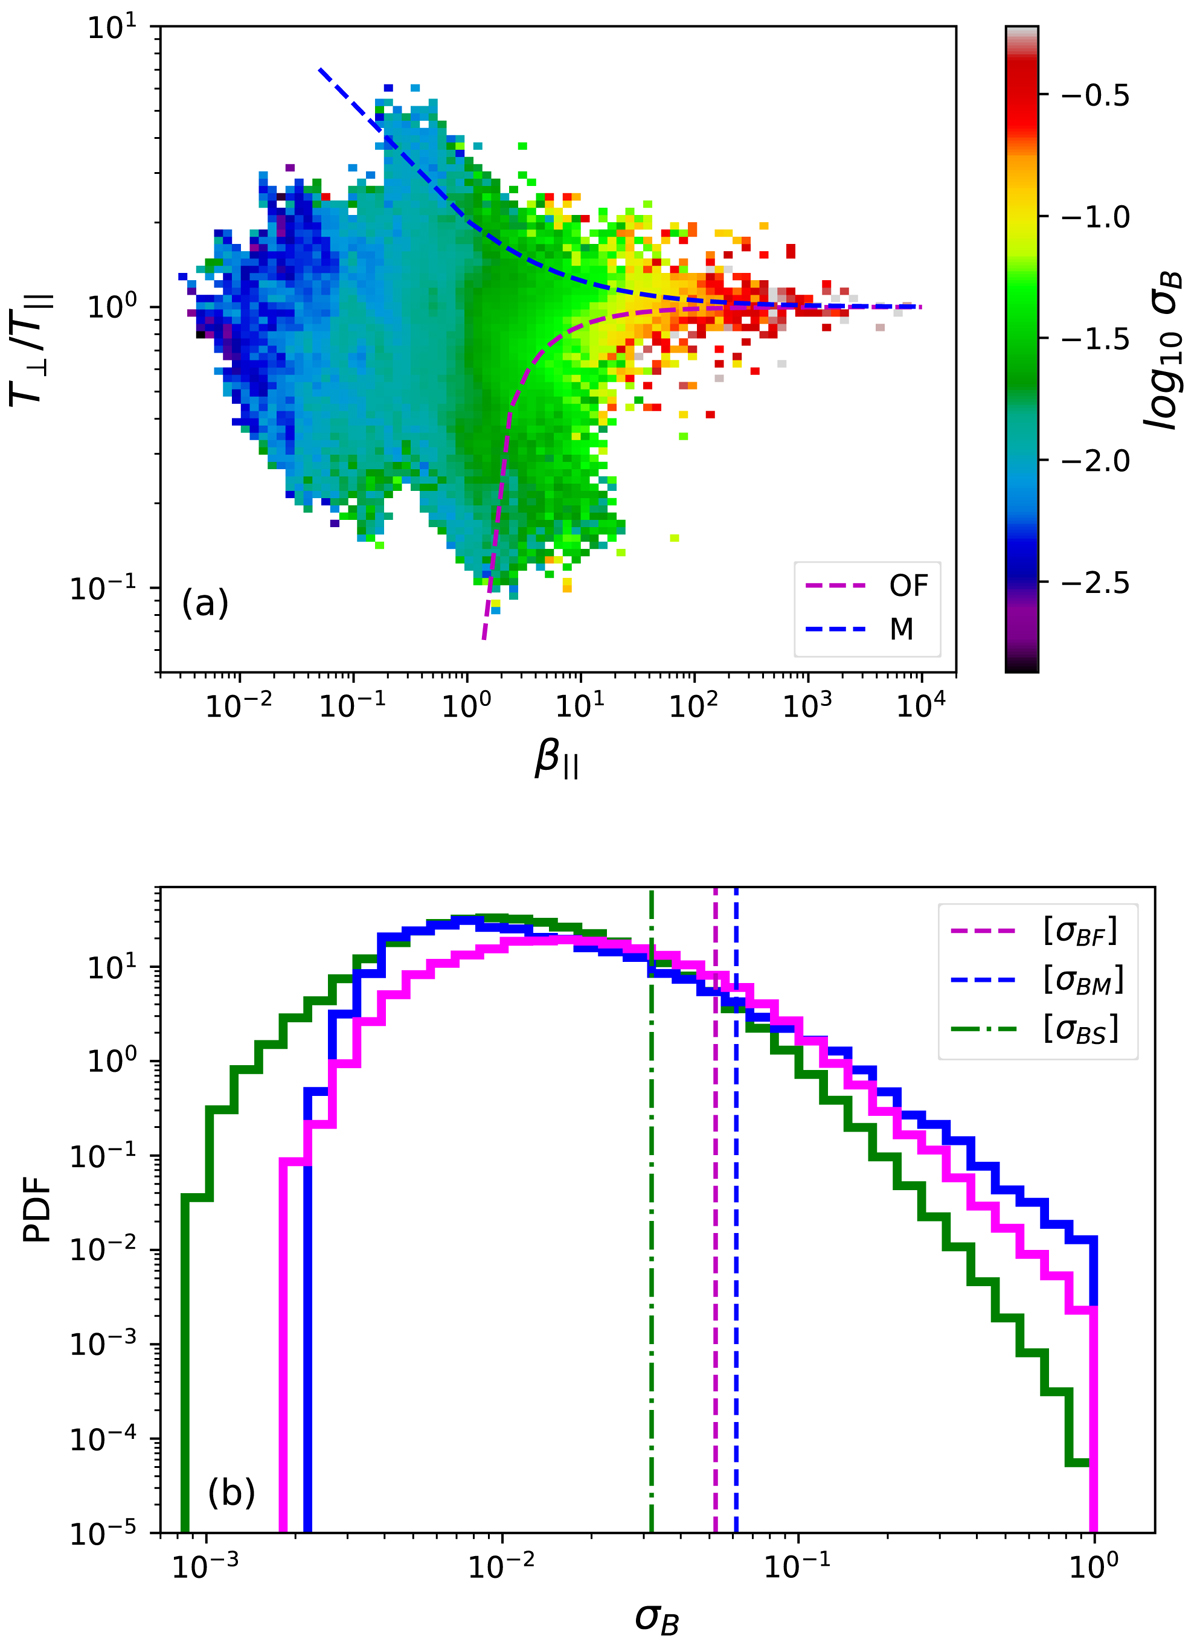
Observed data for σB plotted as: (a) distribution of σB binned and averaged by the bin count in T⊥/T∥–β∥ parameter space. The instability thresholds for the oblique fire-hose (OF) and mirror-mode (M) instabilities are shown as labelled. (b) PDFs of σB for oblique fire-hose unstable (magenta), mirror-mode unstable (blue), and stable (green) points in our dataset. The vertical lines denote the ensemble mean [ ⋅ ] of each dataset.
Current usage metrics show cumulative count of Article Views (full-text article views including HTML views, PDF and ePub downloads, according to the available data) and Abstracts Views on Vision4Press platform.
Data correspond to usage on the plateform after 2015. The current usage metrics is available 48-96 hours after online publication and is updated daily on week days.
Initial download of the metrics may take a while.