Open Access
Fig. A.1
Download original image
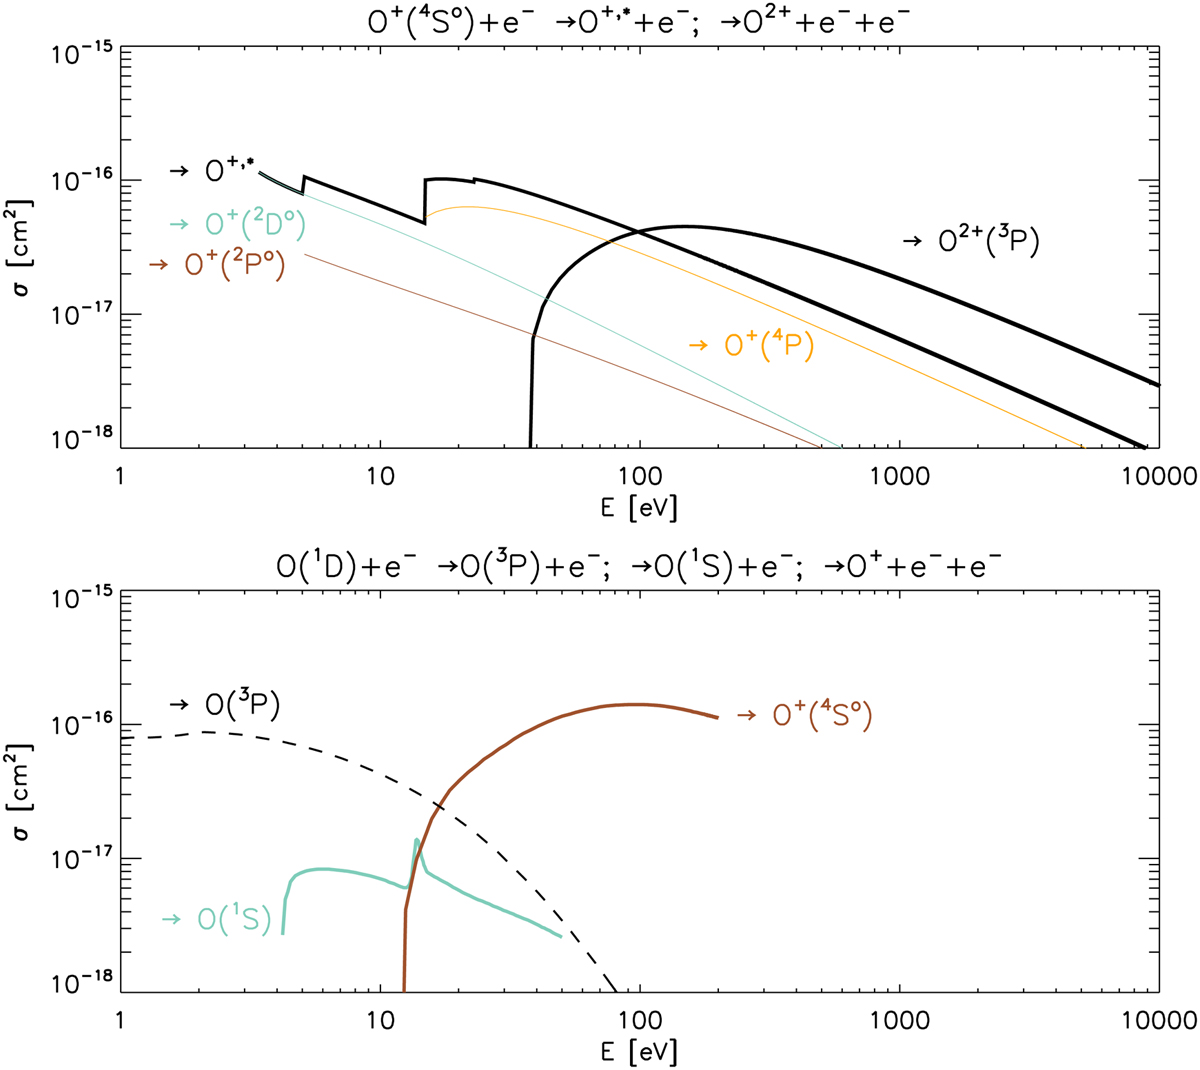
Adopted cross sections for the excitation and ionization of O+(4So) (top) and for (de)excitation and ionization of O(1 D) (bottom). Note: in the top panel, the black curve labeled O+,*· includes all the excitation channels that are shown in the graph.
Current usage metrics show cumulative count of Article Views (full-text article views including HTML views, PDF and ePub downloads, according to the available data) and Abstracts Views on Vision4Press platform.
Data correspond to usage on the plateform after 2015. The current usage metrics is available 48-96 hours after online publication and is updated daily on week days.
Initial download of the metrics may take a while.