Open Access
Fig. 9.
Download original image
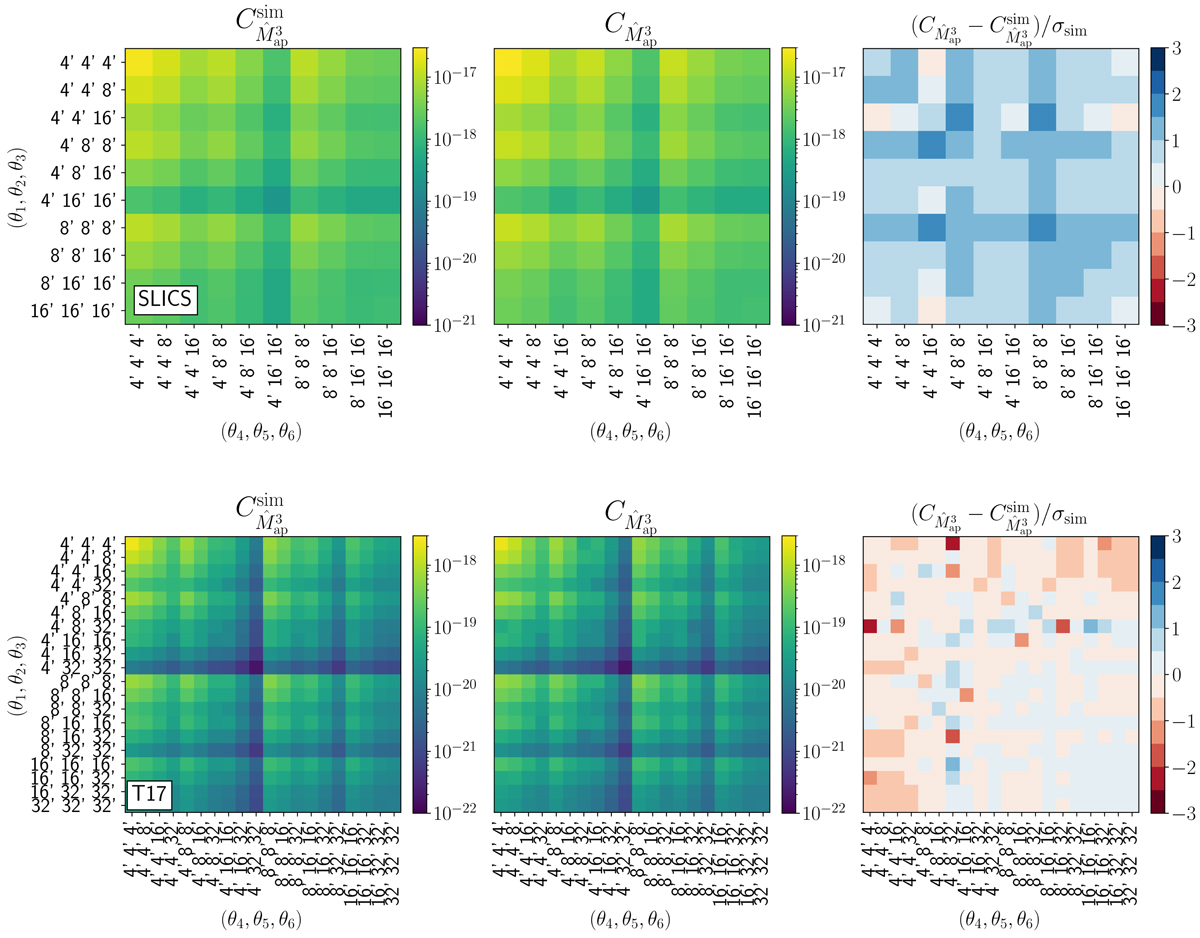
Comparison of measured and modelled covariance for the SLICS (top) and T17 simulations (bottom). Left are the measured covariance, middle are the model predictions; right are the differences between model and simulation, normalised by the simulation bootstrap error.
Current usage metrics show cumulative count of Article Views (full-text article views including HTML views, PDF and ePub downloads, according to the available data) and Abstracts Views on Vision4Press platform.
Data correspond to usage on the plateform after 2015. The current usage metrics is available 48-96 hours after online publication and is updated daily on week days.
Initial download of the metrics may take a while.