Open Access
Fig. 4.
Download original image
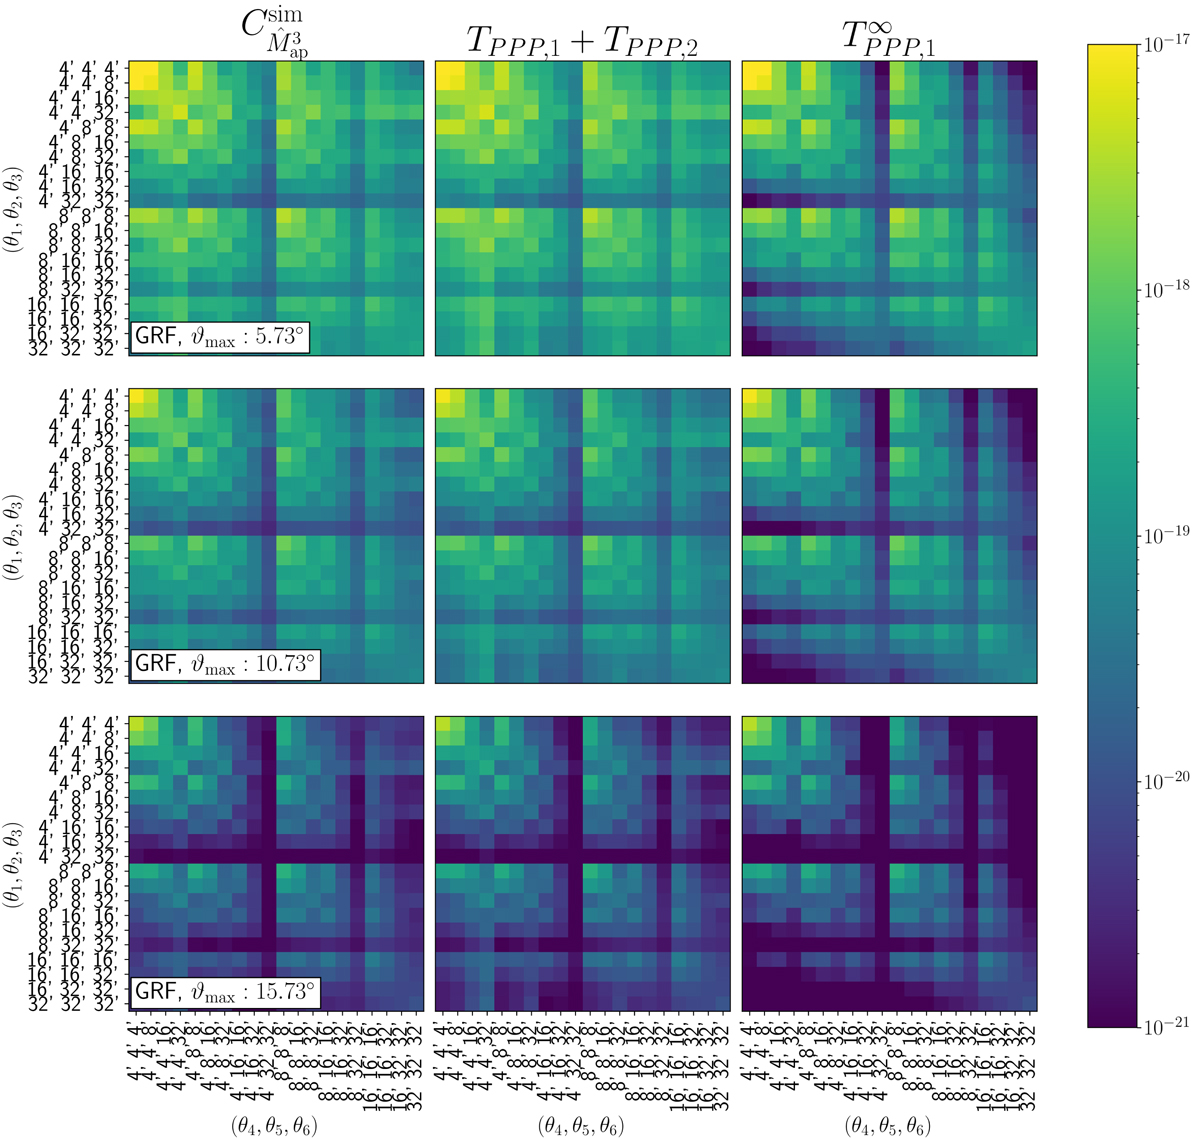
![]() for the GRF, each row is showing a different field size. In the left column are the measured
for the GRF, each row is showing a different field size. In the left column are the measured ![]() from the simulated GRF. The middle column shows the model prediction, including the finite-field term TPPP, 2. The covariances under the large-field approximation, for which TPPP, 2 vanishes, are in the right column.
from the simulated GRF. The middle column shows the model prediction, including the finite-field term TPPP, 2. The covariances under the large-field approximation, for which TPPP, 2 vanishes, are in the right column.
Current usage metrics show cumulative count of Article Views (full-text article views including HTML views, PDF and ePub downloads, according to the available data) and Abstracts Views on Vision4Press platform.
Data correspond to usage on the plateform after 2015. The current usage metrics is available 48-96 hours after online publication and is updated daily on week days.
Initial download of the metrics may take a while.