Open Access
Fig. 10.
Download original image
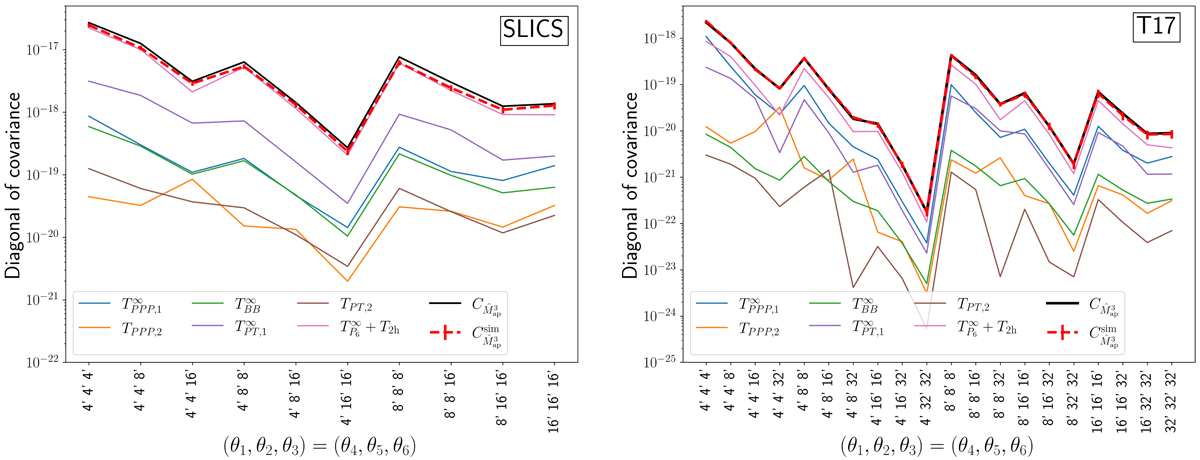
Diagonal of ![]() and the individual covariance terms for the SLICS (left) and the T17 (right). The measurement from the simulation is shown as a red dashed line, while the full modelled
and the individual covariance terms for the SLICS (left) and the T17 (right). The measurement from the simulation is shown as a red dashed line, while the full modelled ![]() is the bold black line. The other lines show individual terms. Error bars on the simulated covariances originate from bootstrapping.
is the bold black line. The other lines show individual terms. Error bars on the simulated covariances originate from bootstrapping.
Current usage metrics show cumulative count of Article Views (full-text article views including HTML views, PDF and ePub downloads, according to the available data) and Abstracts Views on Vision4Press platform.
Data correspond to usage on the plateform after 2015. The current usage metrics is available 48-96 hours after online publication and is updated daily on week days.
Initial download of the metrics may take a while.