Fig. 8.
Download original image
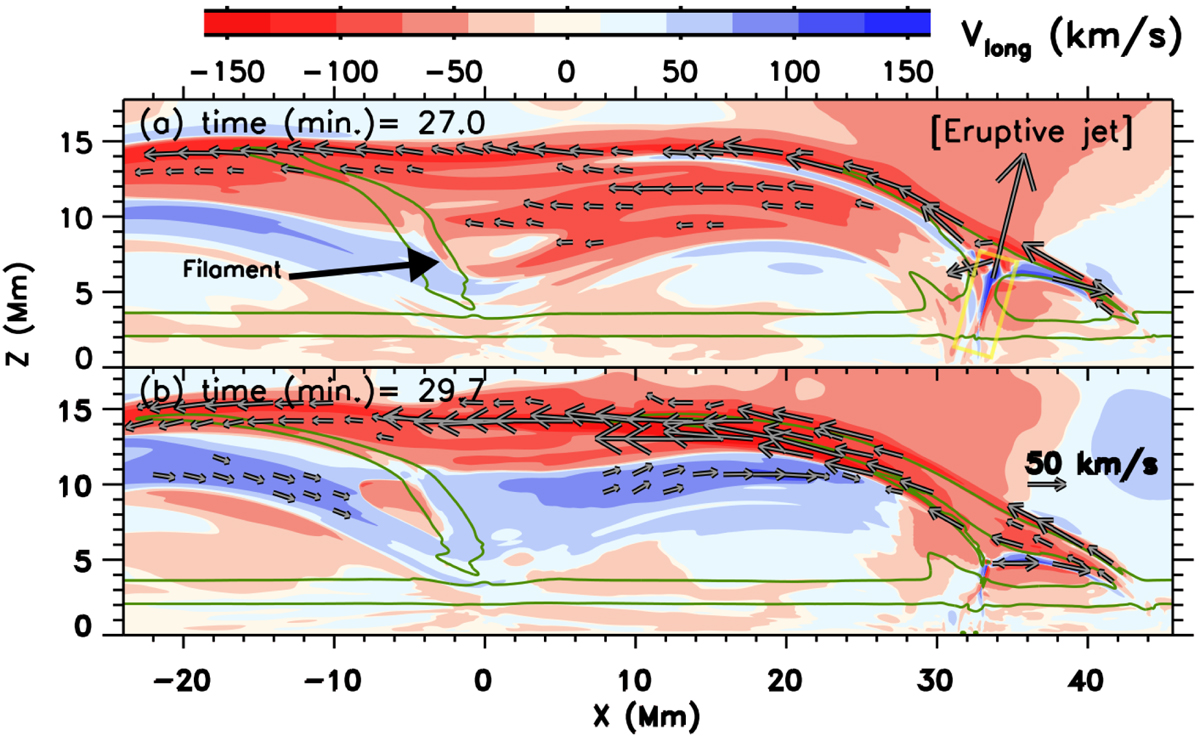
Interaction of the ejected plasma with a filament channel adapted from Luna & Moreno-Insertis (2021). Both panels show the evolution of the jet at t = 27(a) and t = 29.7(b) minutes after the start of the numerical simulation. The green contours are isolines of the density. Around x = 0, we see the green contour of the filament suspended in dips of arcades of magnetic field (indicated by a black arrow in panel a). Red and blue are the velocity flows projected along the magnetic field lines. The vector field shows the flow velocity. For better visualisation, only vectors with a velocity greater than 20 km s−1 are shown. To show the scale of the velocity vectors, a 50 km s−1 arrow is shown on the right side of panel b.
Current usage metrics show cumulative count of Article Views (full-text article views including HTML views, PDF and ePub downloads, according to the available data) and Abstracts Views on Vision4Press platform.
Data correspond to usage on the plateform after 2015. The current usage metrics is available 48-96 hours after online publication and is updated daily on week days.
Initial download of the metrics may take a while.