Fig. 7.
Download original image
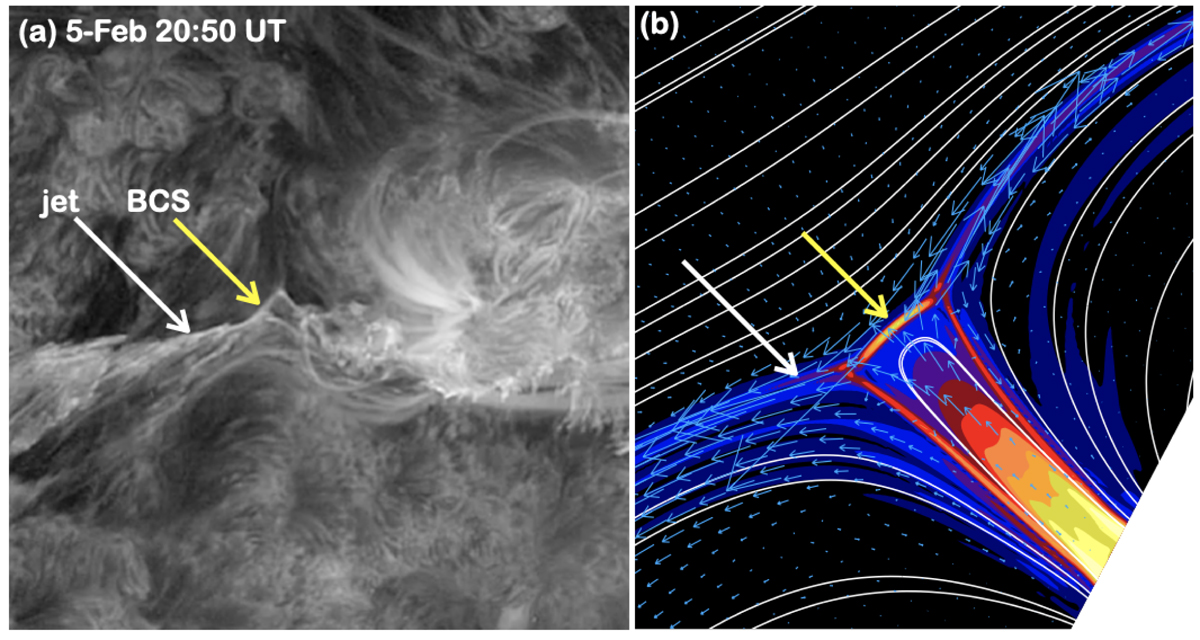
Similarity between the observation of event 1 on February 5, 2015, and the numerical model of Luna & Moreno-Insertis (2021). The left panel is identical to panel b of Fig. 3; the right panel shows the electric current distribution of the model of Luna & Moreno-Insertis (2021) (adapted from their Fig. 4c). The flat breakout current sheet is marked in both panels by a yellow arrow.
Current usage metrics show cumulative count of Article Views (full-text article views including HTML views, PDF and ePub downloads, according to the available data) and Abstracts Views on Vision4Press platform.
Data correspond to usage on the plateform after 2015. The current usage metrics is available 48-96 hours after online publication and is updated daily on week days.
Initial download of the metrics may take a while.