Fig. 5.
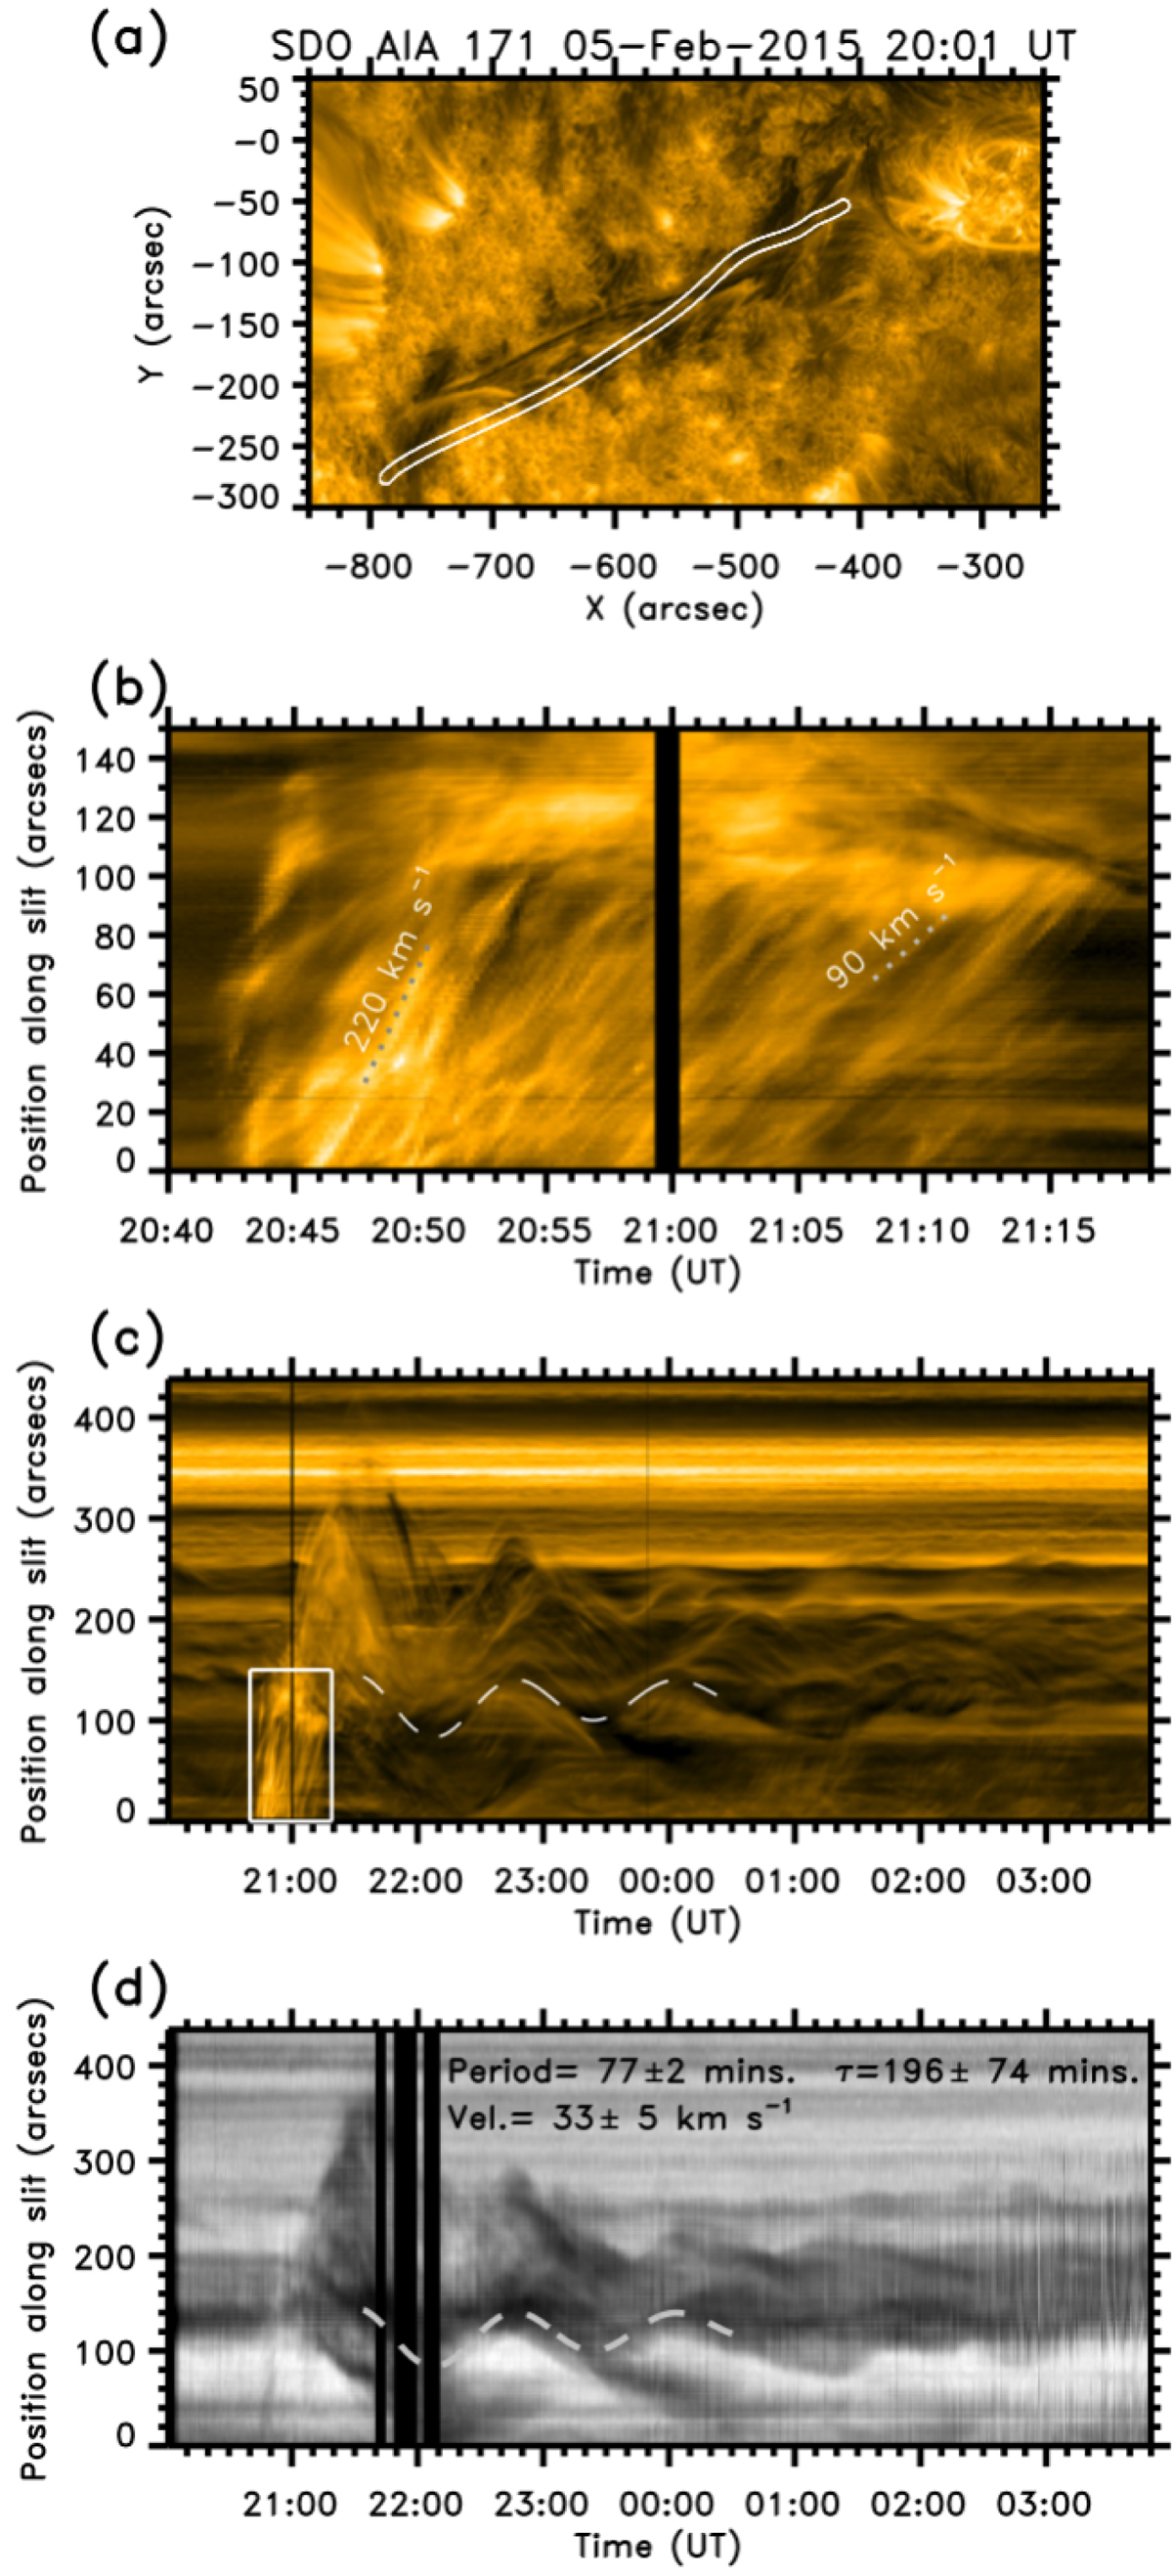
Download original image
Trace of the oscillations in the filament for the first event on February 5, 2015, observed with AIA 171 Å and Hα. Panel a: filament seen in absorption in AIA 171 Å on February 5, 2015, with the artificial slit used to construct the time–distance diagrams (panels b-d) shown as a white contour. Panel b: time–distance diagram for the AIA171 image along the topmost 150″ of the slit; panel b in Fig. 3, taken at time 20:50 UT. Panels c and d contain the time–distance diagrams for the brightness along the curved slit, clearly showing the oscillatory patterns analysed in this paper. The white tracks in panels c and d show one of the fits obtained for the oscillation, which has a period of 77 min, velocity amplitude of 33 km s−1, and a damping time of τ = 196 min. The black vertical stripes in panels b, c, and d are data gaps.
Current usage metrics show cumulative count of Article Views (full-text article views including HTML views, PDF and ePub downloads, according to the available data) and Abstracts Views on Vision4Press platform.
Data correspond to usage on the plateform after 2015. The current usage metrics is available 48-96 hours after online publication and is updated daily on week days.
Initial download of the metrics may take a while.