Fig. 13.
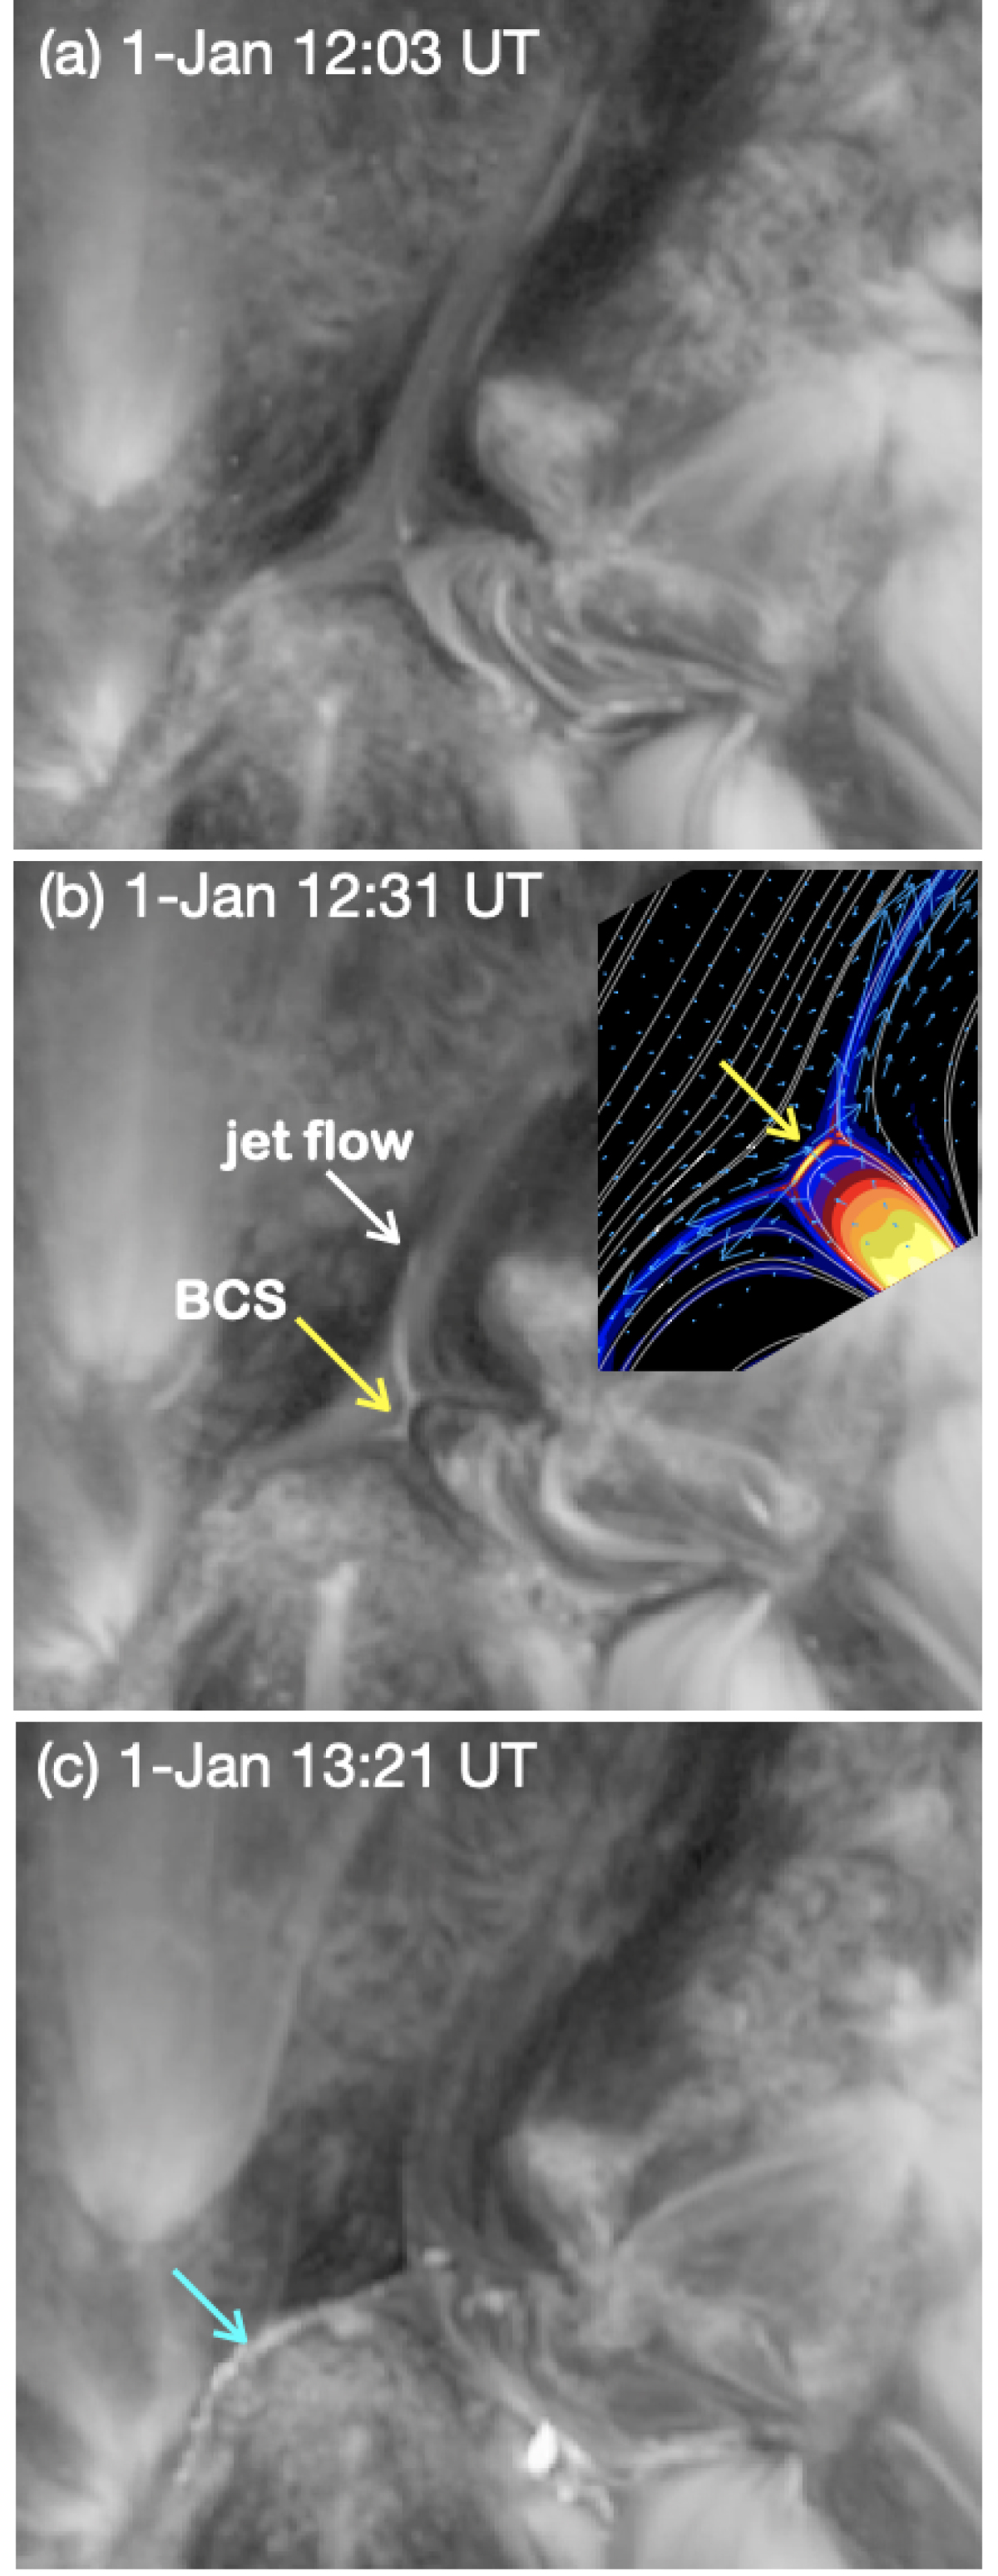
Download original image
Zoom onto the jet base region in 171 Å maps as indicated with the blue rectangular box in Fig. 9c. The three panels show three stages of the temporal evolution of the jet. Panel a shows an X-point structure can be identified in the central part. This structure evolves and acquires a BCS H-type shape marked by the white arrow. Important flows are seen emanating from the H structure. The inset in panel b shows the electric currents distribution from the Luna & Moreno-Insertis (2021) model (adapted from their Fig. 4b). The white curves are the magnetic field lines and the blue vectors are the velocities of the plasma. Finally, in panel c, this structure disappears and a brightening is seen around it. The cyan arrow in panel c shows the brightening along the field lines associated with the eruptive phase. Associated animation is available online.
Current usage metrics show cumulative count of Article Views (full-text article views including HTML views, PDF and ePub downloads, according to the available data) and Abstracts Views on Vision4Press platform.
Data correspond to usage on the plateform after 2015. The current usage metrics is available 48-96 hours after online publication and is updated daily on week days.
Initial download of the metrics may take a while.