Open Access
Fig. 11.
Download original image
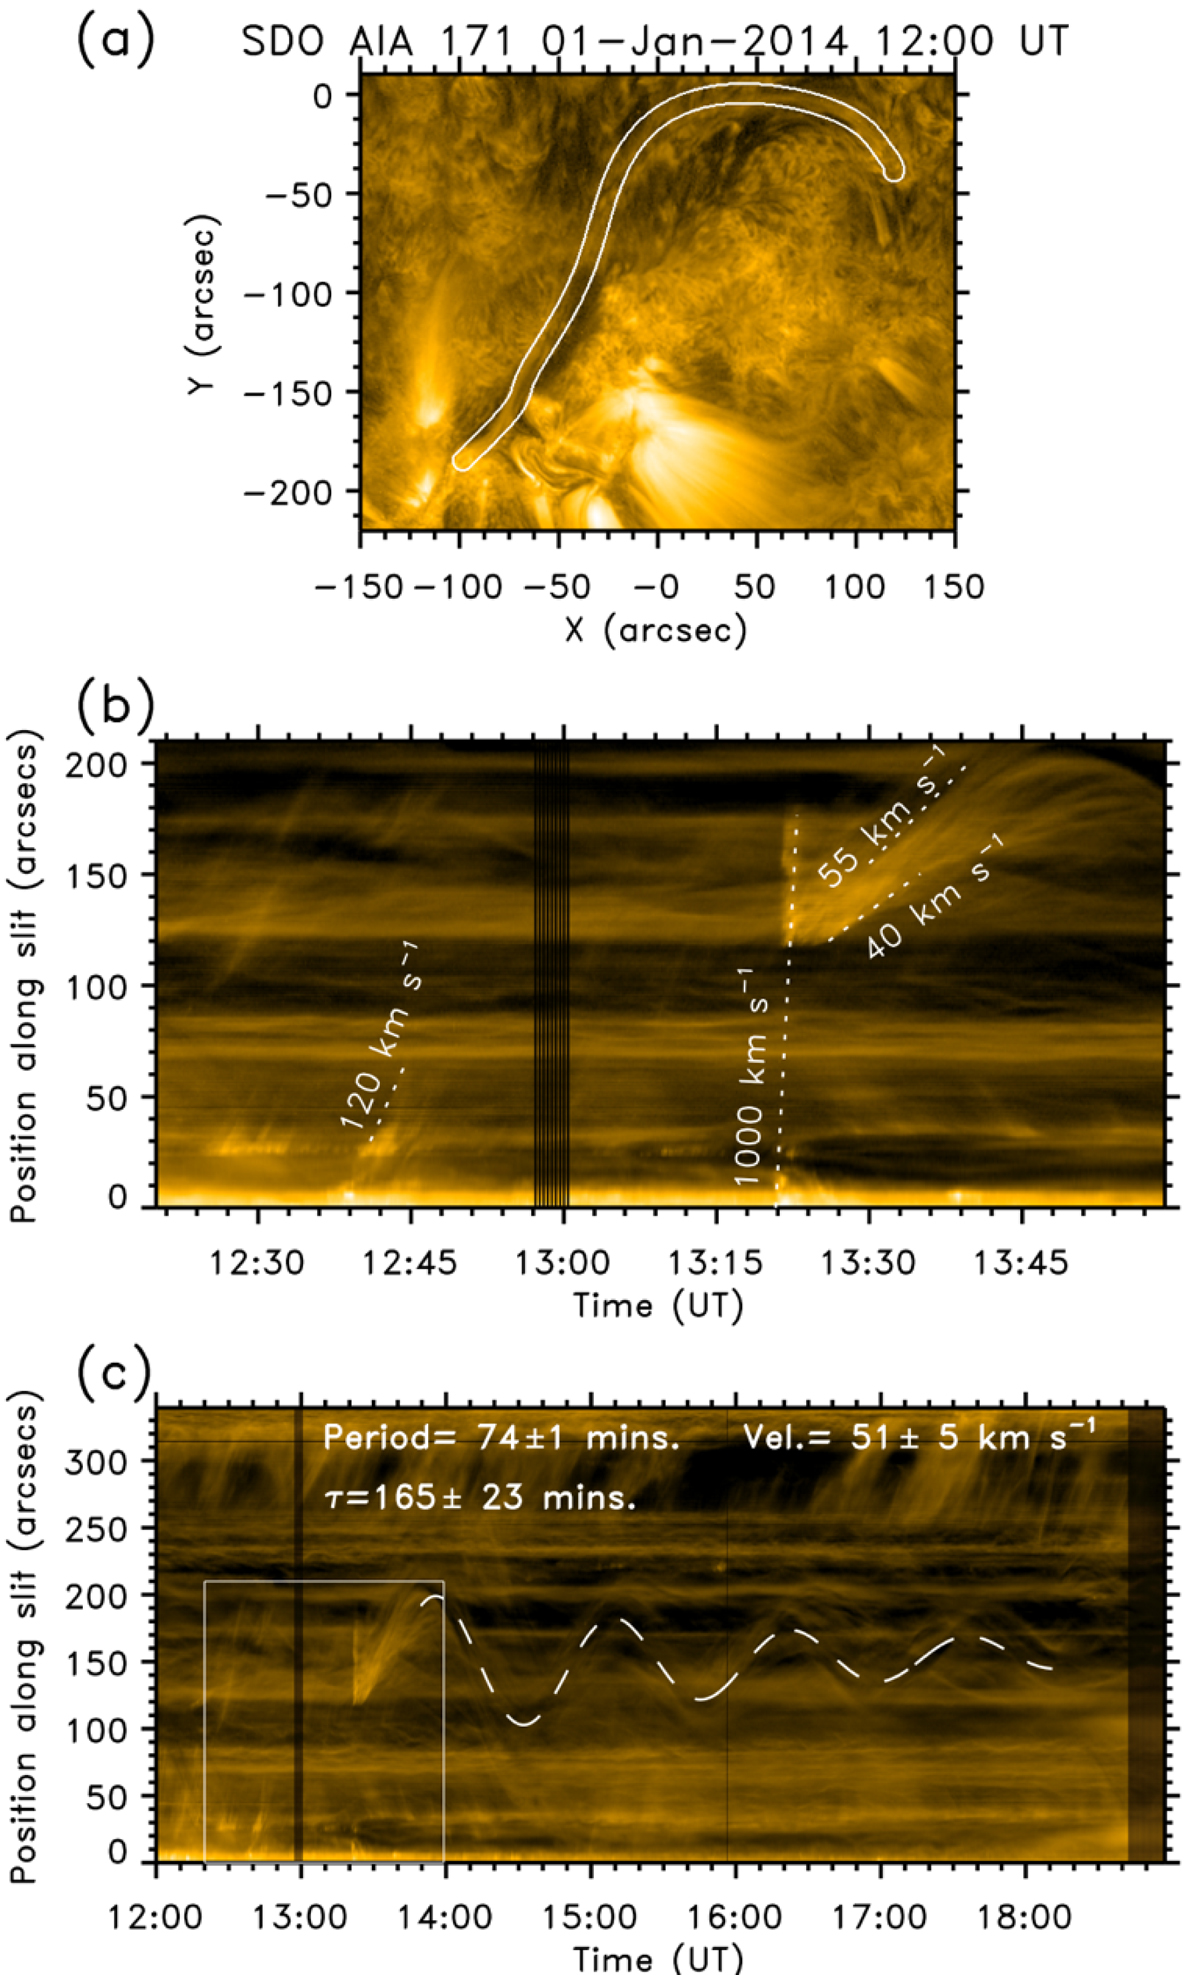
Trace of the oscillations in the filament for the second event on January 1, 2014, observed with AIA 171 Å. Here we show the filament seen in absorption in AIA 171 Å. The artificial slit is shown as a white contour shown in panel a to construct the time–distance diagram shown in panels b and c.
Current usage metrics show cumulative count of Article Views (full-text article views including HTML views, PDF and ePub downloads, according to the available data) and Abstracts Views on Vision4Press platform.
Data correspond to usage on the plateform after 2015. The current usage metrics is available 48-96 hours after online publication and is updated daily on week days.
Initial download of the metrics may take a while.