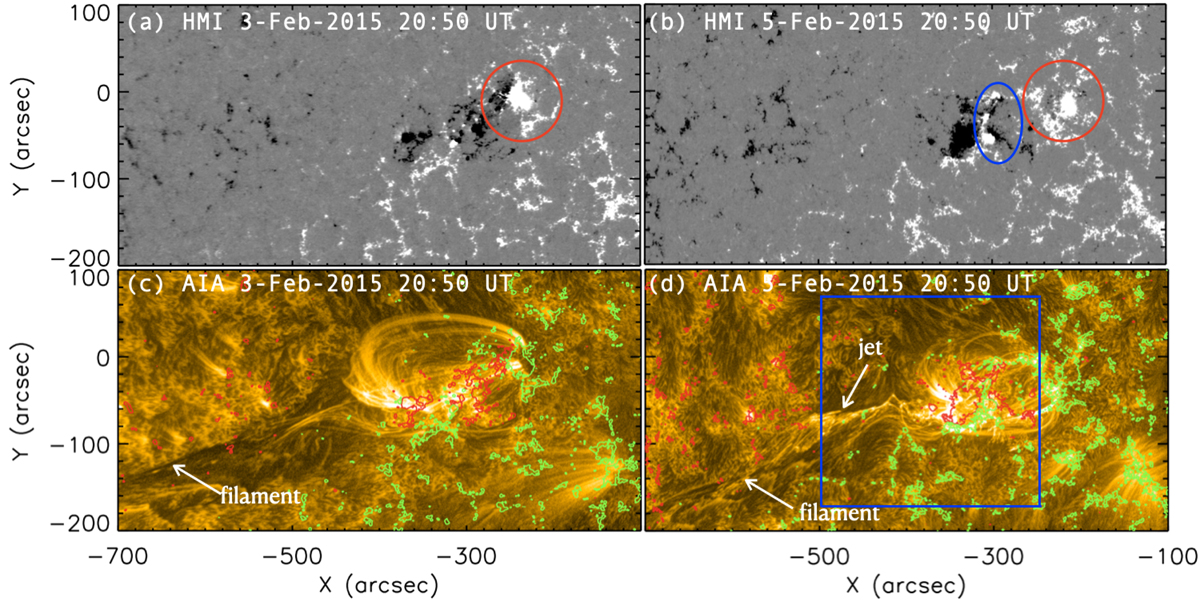
Fig. 1.

Download original image
Evolution of AR NOAA 12280 on February 3–5, 2015. Top panels: HMI magnetograms, bottom panels: AIA 171 images. The emergence of magnetic bipoles is clearly visible in the neighbourhood of the AR and near the jet base. Two examples: the red circle in the top panels a,b indicates a new emerging bipole on February 3; this was followed on February 5 by an another emerging bipole marked by the blue oval (panel b). The green and red contours are the HMI magnetic field contours of ±100 Gauss in strength, respectively. The images are aligned together at 20:50 UT on February 5, 2015. The blue square is the FOV of Fig. 3.
Current usage metrics show cumulative count of Article Views (full-text article views including HTML views, PDF and ePub downloads, according to the available data) and Abstracts Views on Vision4Press platform.
Data correspond to usage on the plateform after 2015. The current usage metrics is available 48-96 hours after online publication and is updated daily on week days.
Initial download of the metrics may take a while.


