Fig. 7.
Download original image
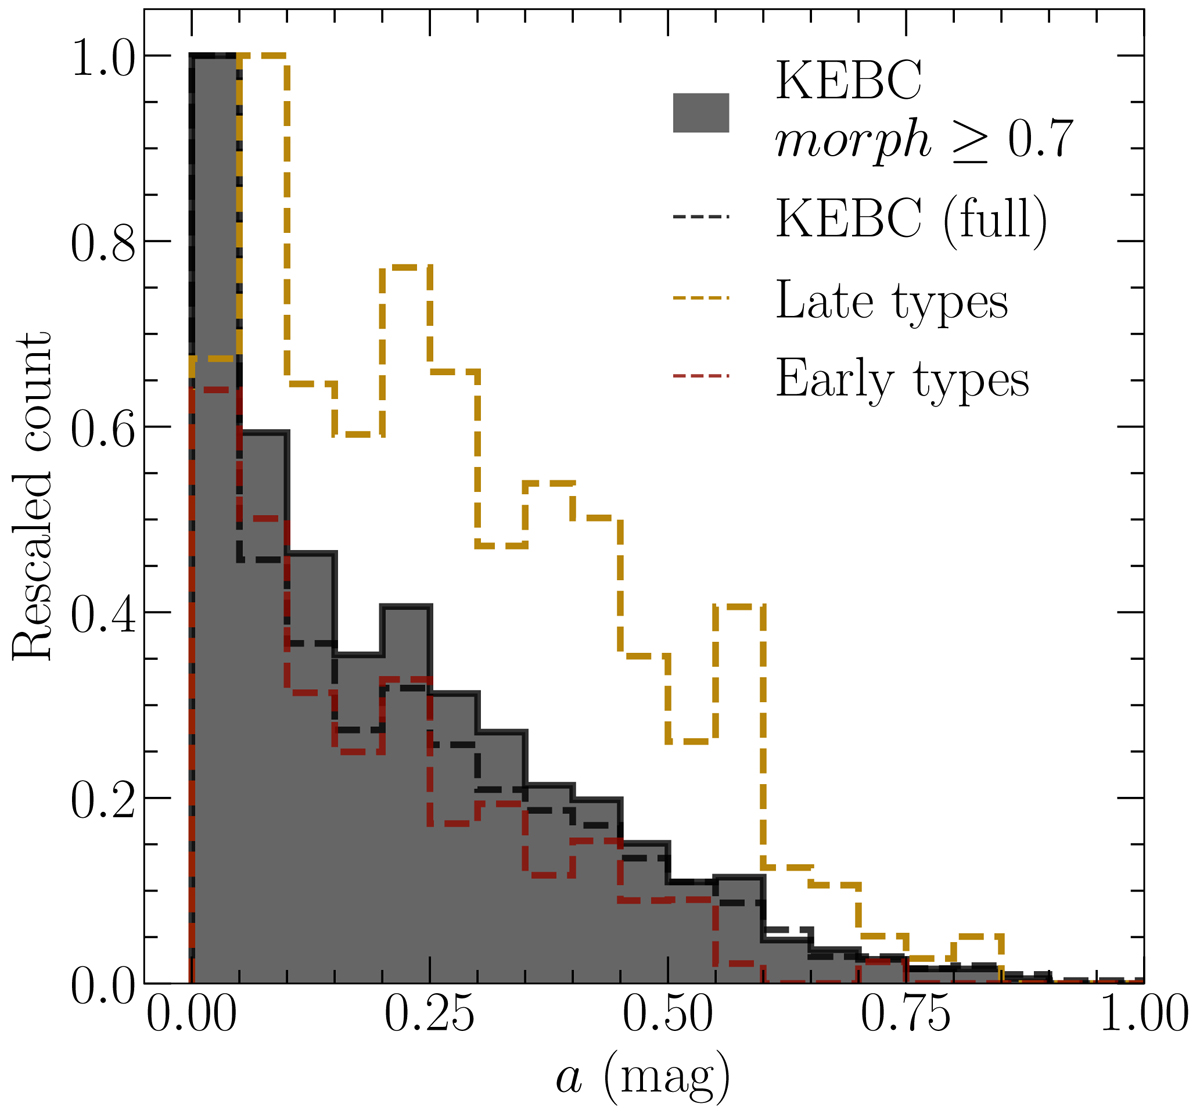
Amplitude distribution of the late-type (dashed orange line) and early-type (dashed red line) contact binaries in our cleaned sample. The dashed black line shows the amplitude distribution of the full KEBC, and the solid black line shows the distribution of the KEBC with morph ≥ 0.7. The late- and early-type histograms are weighted by the probability of being a contact binary of the respective type.
Current usage metrics show cumulative count of Article Views (full-text article views including HTML views, PDF and ePub downloads, according to the available data) and Abstracts Views on Vision4Press platform.
Data correspond to usage on the plateform after 2015. The current usage metrics is available 48-96 hours after online publication and is updated daily on week days.
Initial download of the metrics may take a while.