Fig. 3.
Download original image
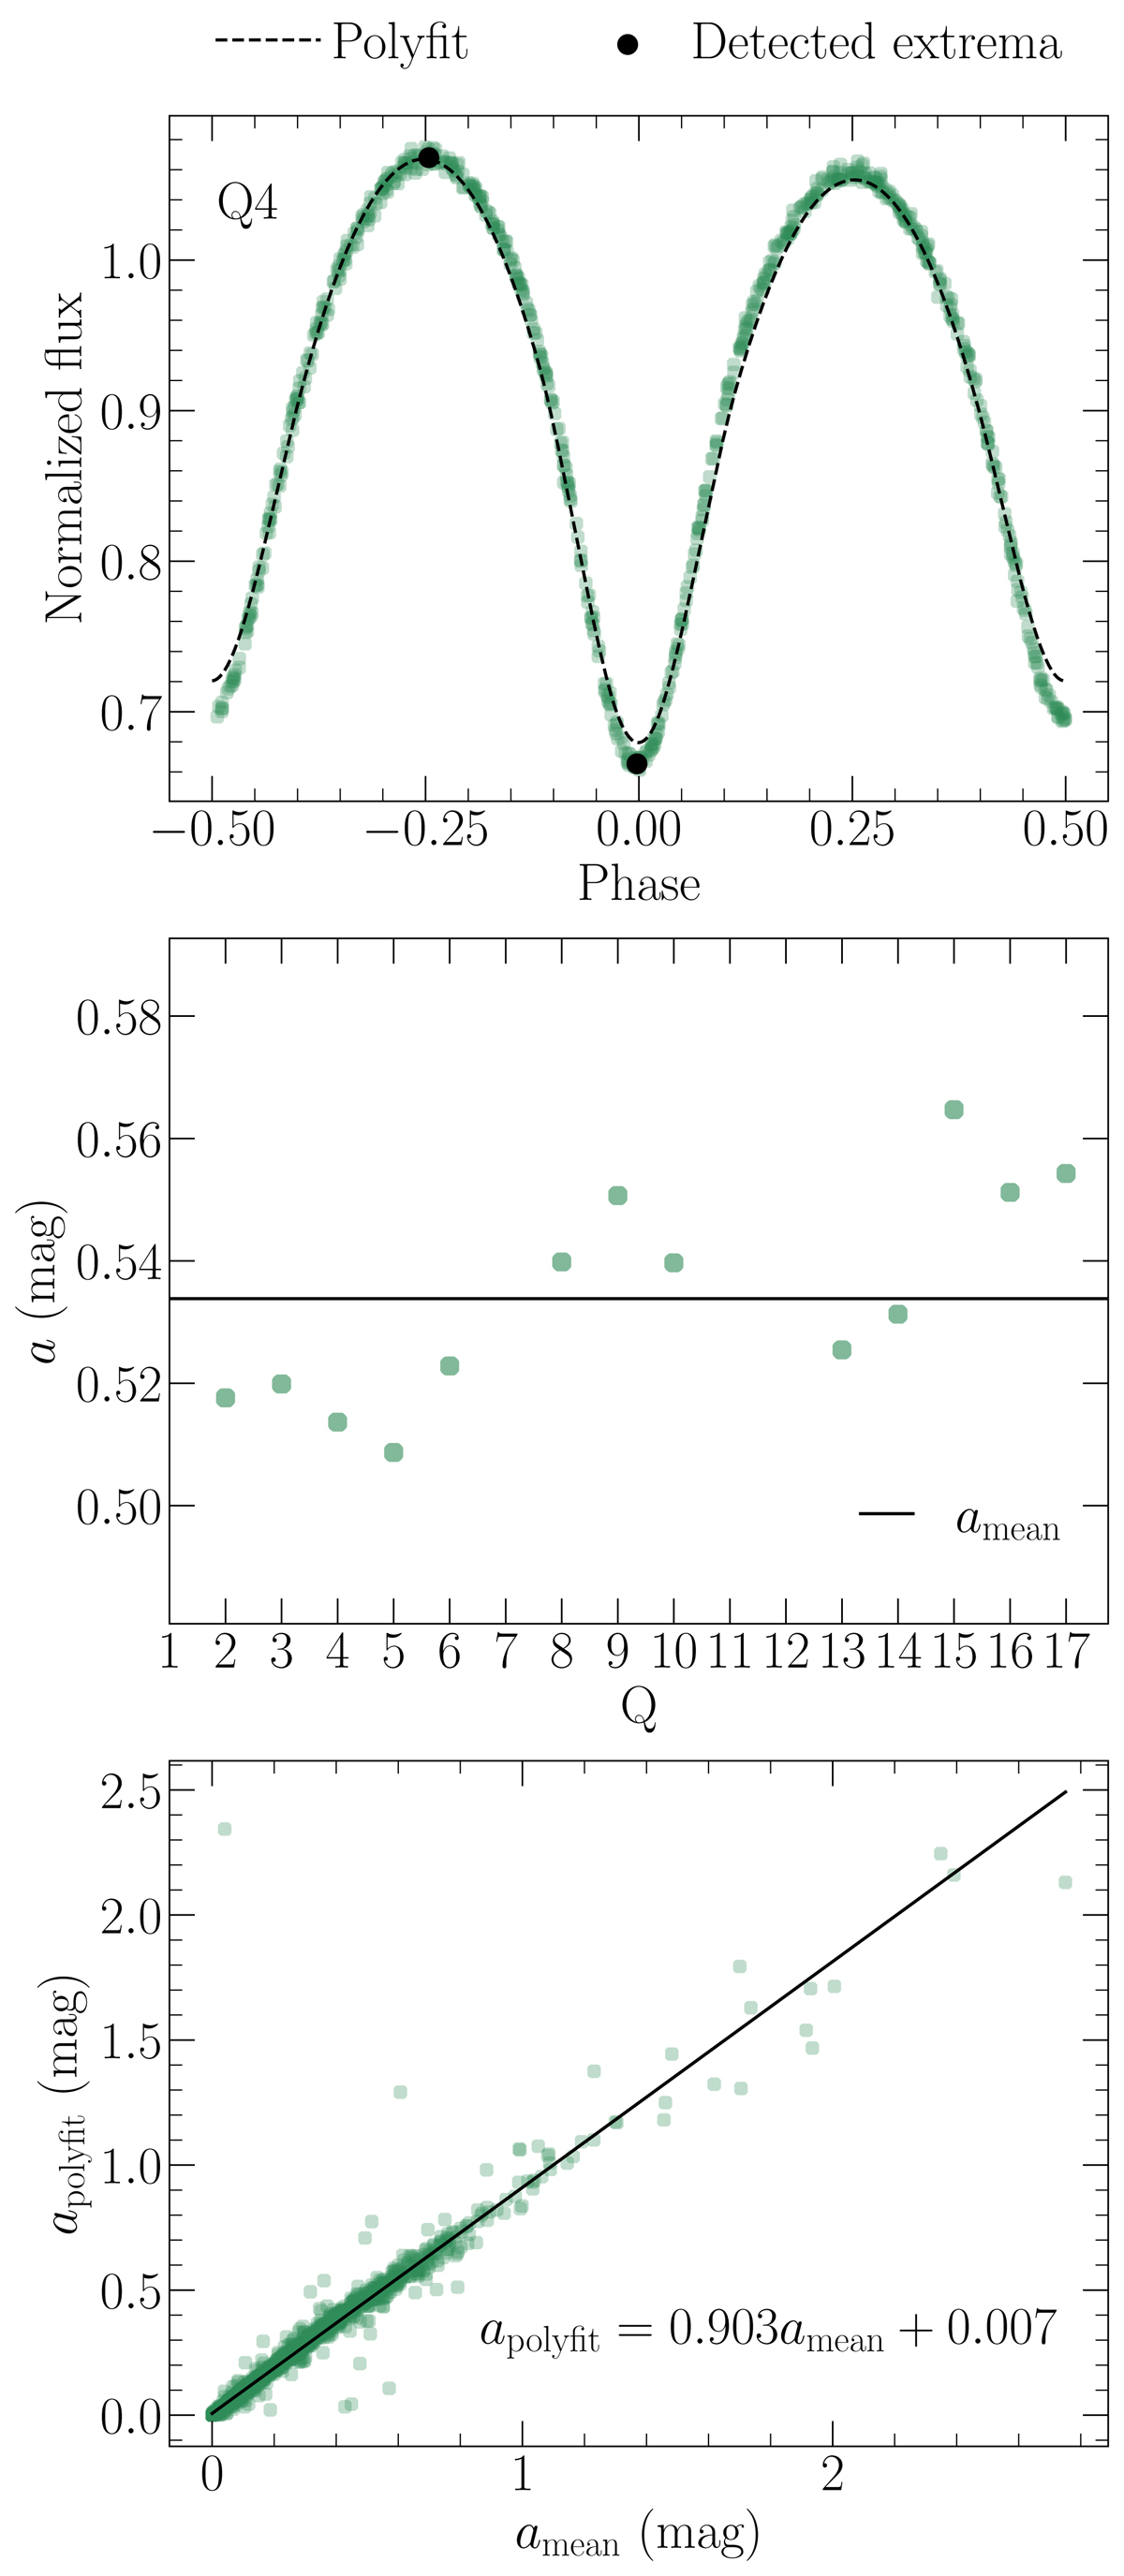
Procedure for estimating light-curve amplitudes. Top panel: detrended Kepler light curve of the contact binary KIC 7871200 observed during quarter Q4. The dashed line is the result of polyfit. The data points labeled “Detected extrema” correspond to the minimum and maximum normalized fluxes resulting from the procedure described in Sect. 3.3. Middle panel: photometric amplitudes extracted from the light curves observed during the individual Kepler quarters. The solid black line represents the arithmetic average of the values. Bottom panel: comparison of photometric amplitudes resulting from our procedure (x-axis) and polyfit (y-axis). The slope of the line indicates a downward bias in the estimates from polyfit, most likely resulting from its tendency to underestimate the depth of light-curve minima.
Current usage metrics show cumulative count of Article Views (full-text article views including HTML views, PDF and ePub downloads, according to the available data) and Abstracts Views on Vision4Press platform.
Data correspond to usage on the plateform after 2015. The current usage metrics is available 48-96 hours after online publication and is updated daily on week days.
Initial download of the metrics may take a while.