Open Access
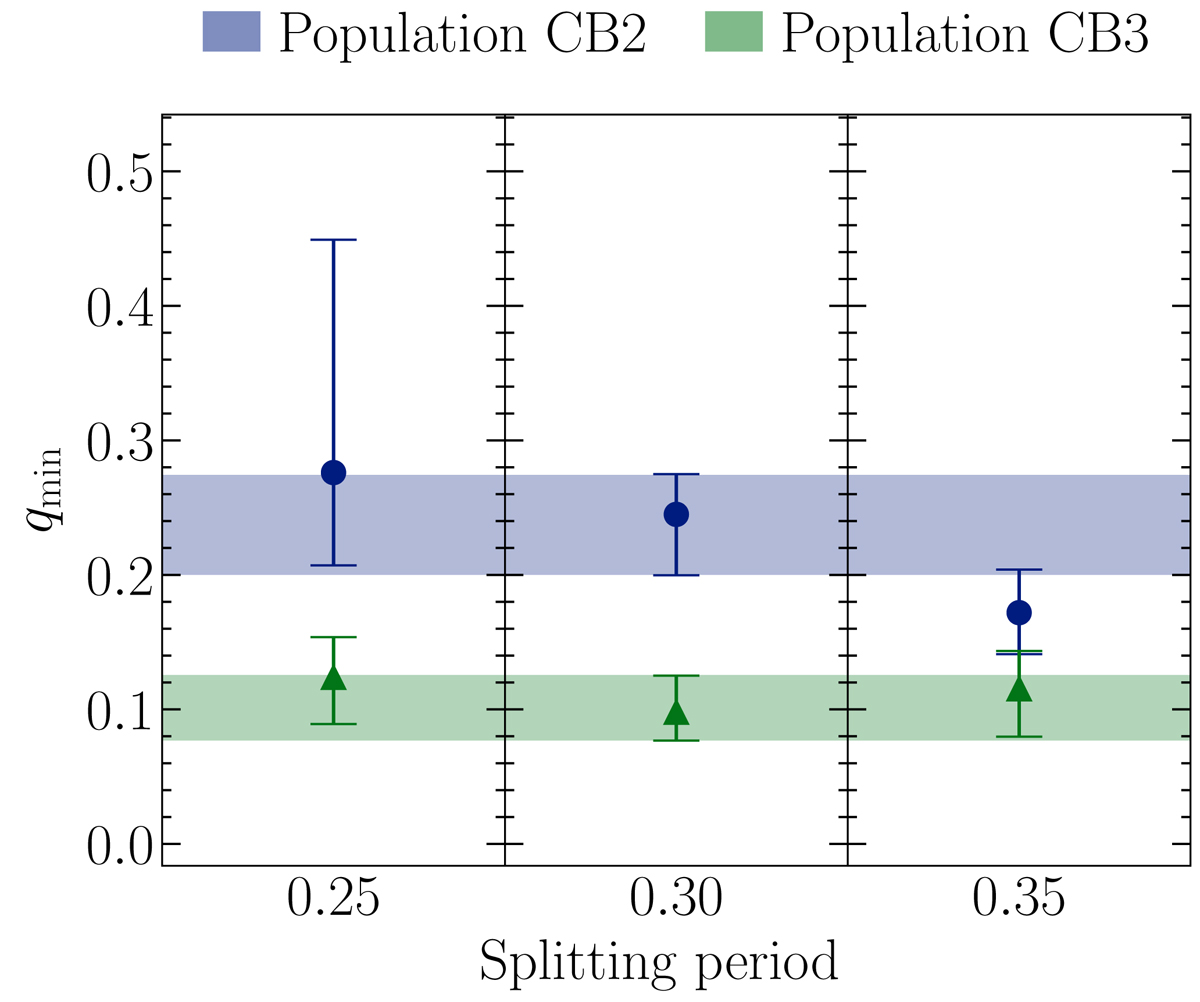
Fig. 13.
Download original image
Dependence of qmin on the splitting period for populations CB2 and CB3. The colored bands represent the 1σ credible intervals of the fiducial models. For the purpose of this plot, we lowered the probability cutoff of the fiducial model for population CB3 from 0.8 to 0.5. The full posterior is plotted in Fig. C.3.
Current usage metrics show cumulative count of Article Views (full-text article views including HTML views, PDF and ePub downloads, according to the available data) and Abstracts Views on Vision4Press platform.
Data correspond to usage on the plateform after 2015. The current usage metrics is available 48-96 hours after online publication and is updated daily on week days.
Initial download of the metrics may take a while.