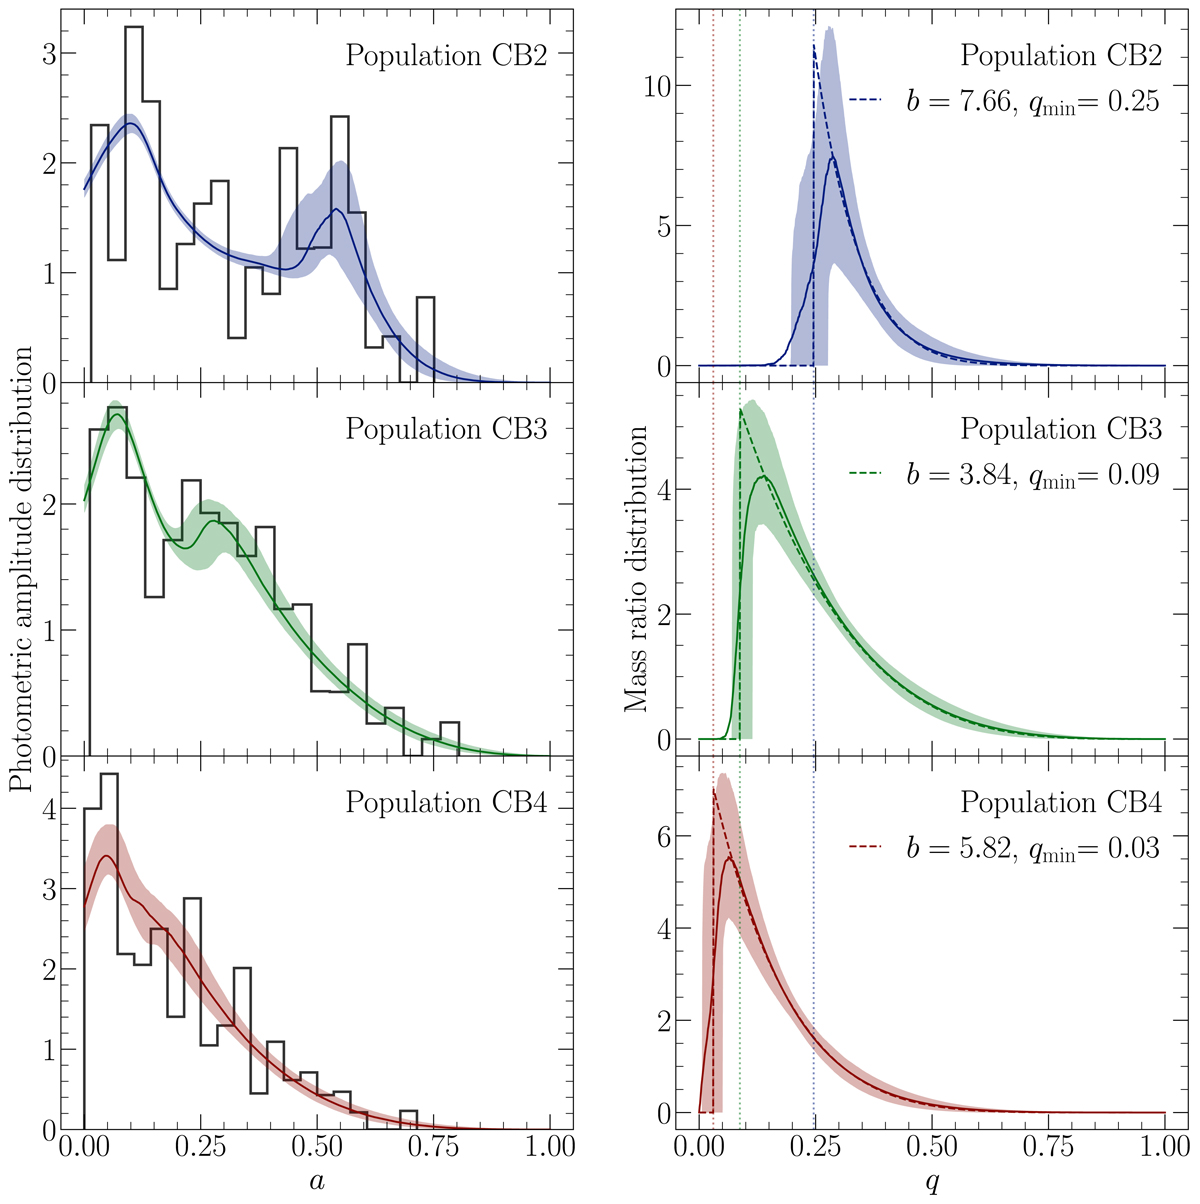
Fig. 10.
Download original image
Amplitude (left panel) and mass-ratio (right panel) distributions for our three populations CB2, CB3, and CB4. The solid black lines in the left panel show weighted histograms of the observed data. The solid blue, green, and red lines in both panels are obtained by marginalizing out the functional form of the Q2 power law, and the dashed lines show Q2 evaluated for the median values of b and qmin. The colored bands represent the 1σ credible intervals around the marginalized amplitude and mass-ratio distributions. The vertical dotted lines in the right panel compare the median values of qmin between the three populations.
Current usage metrics show cumulative count of Article Views (full-text article views including HTML views, PDF and ePub downloads, according to the available data) and Abstracts Views on Vision4Press platform.
Data correspond to usage on the plateform after 2015. The current usage metrics is available 48-96 hours after online publication and is updated daily on week days.
Initial download of the metrics may take a while.