Open Access
Fig. 1.
Download original image
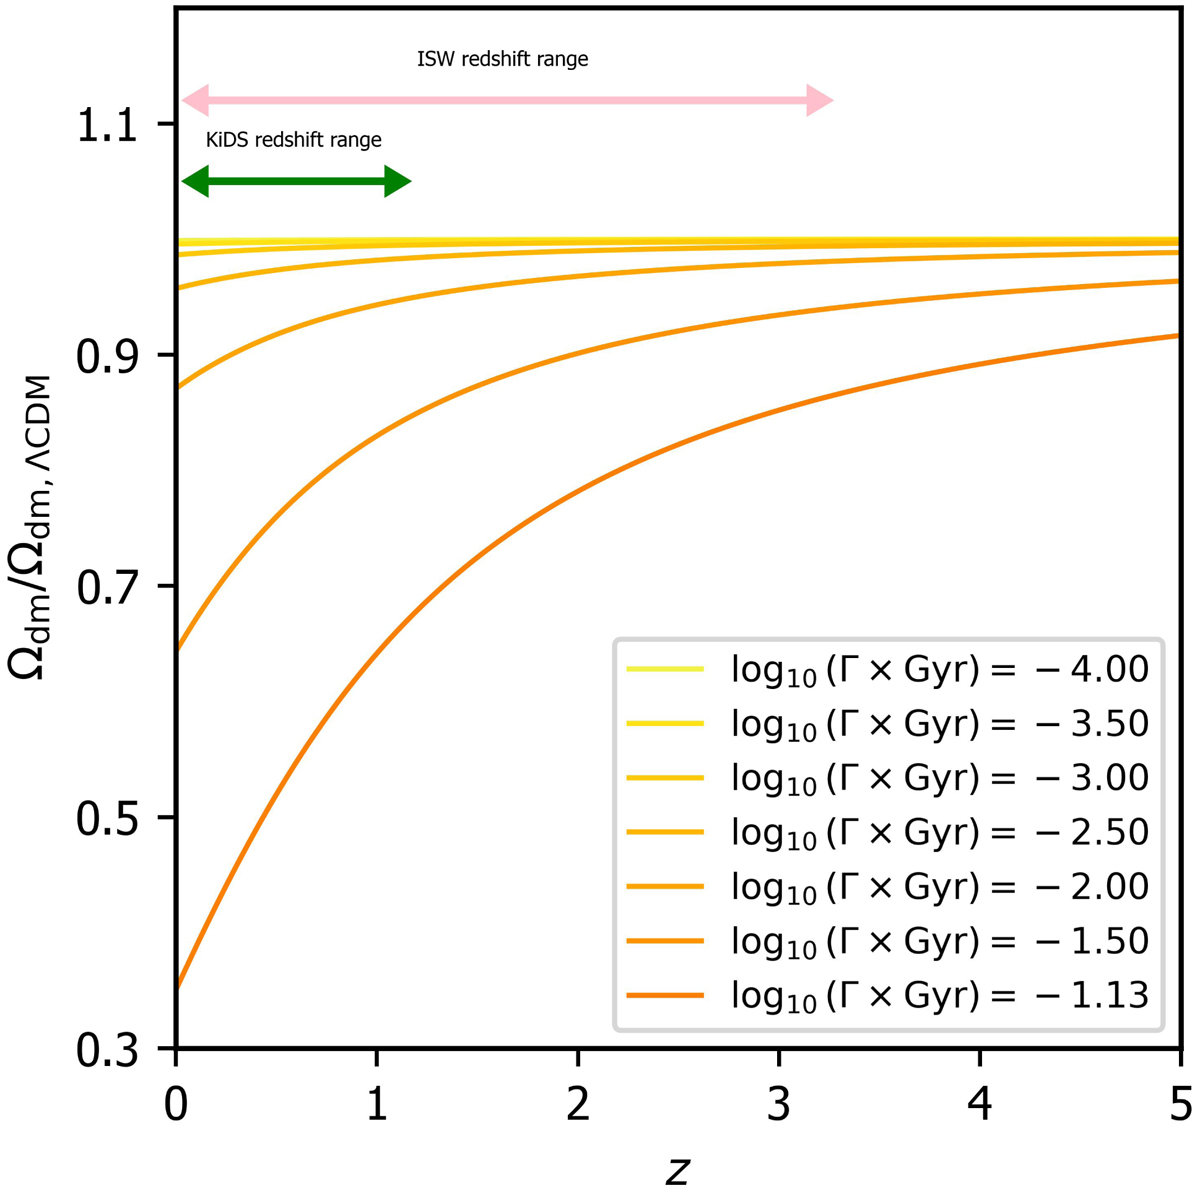
Redshift evolution of the DM abundance for different DM decay rates (Ωdm) compared to the corresponding ΛCDM model (Ωdm, ΛCDM). We assume that all DM is unstable (f = 1). The green and pink arrows indicate the sensitivity ranges of the WL data from KiDS and the ISW effect from Planck.
Current usage metrics show cumulative count of Article Views (full-text article views including HTML views, PDF and ePub downloads, according to the available data) and Abstracts Views on Vision4Press platform.
Data correspond to usage on the plateform after 2015. The current usage metrics is available 48-96 hours after online publication and is updated daily on week days.
Initial download of the metrics may take a while.