Open Access
Fig. 9
Download original image
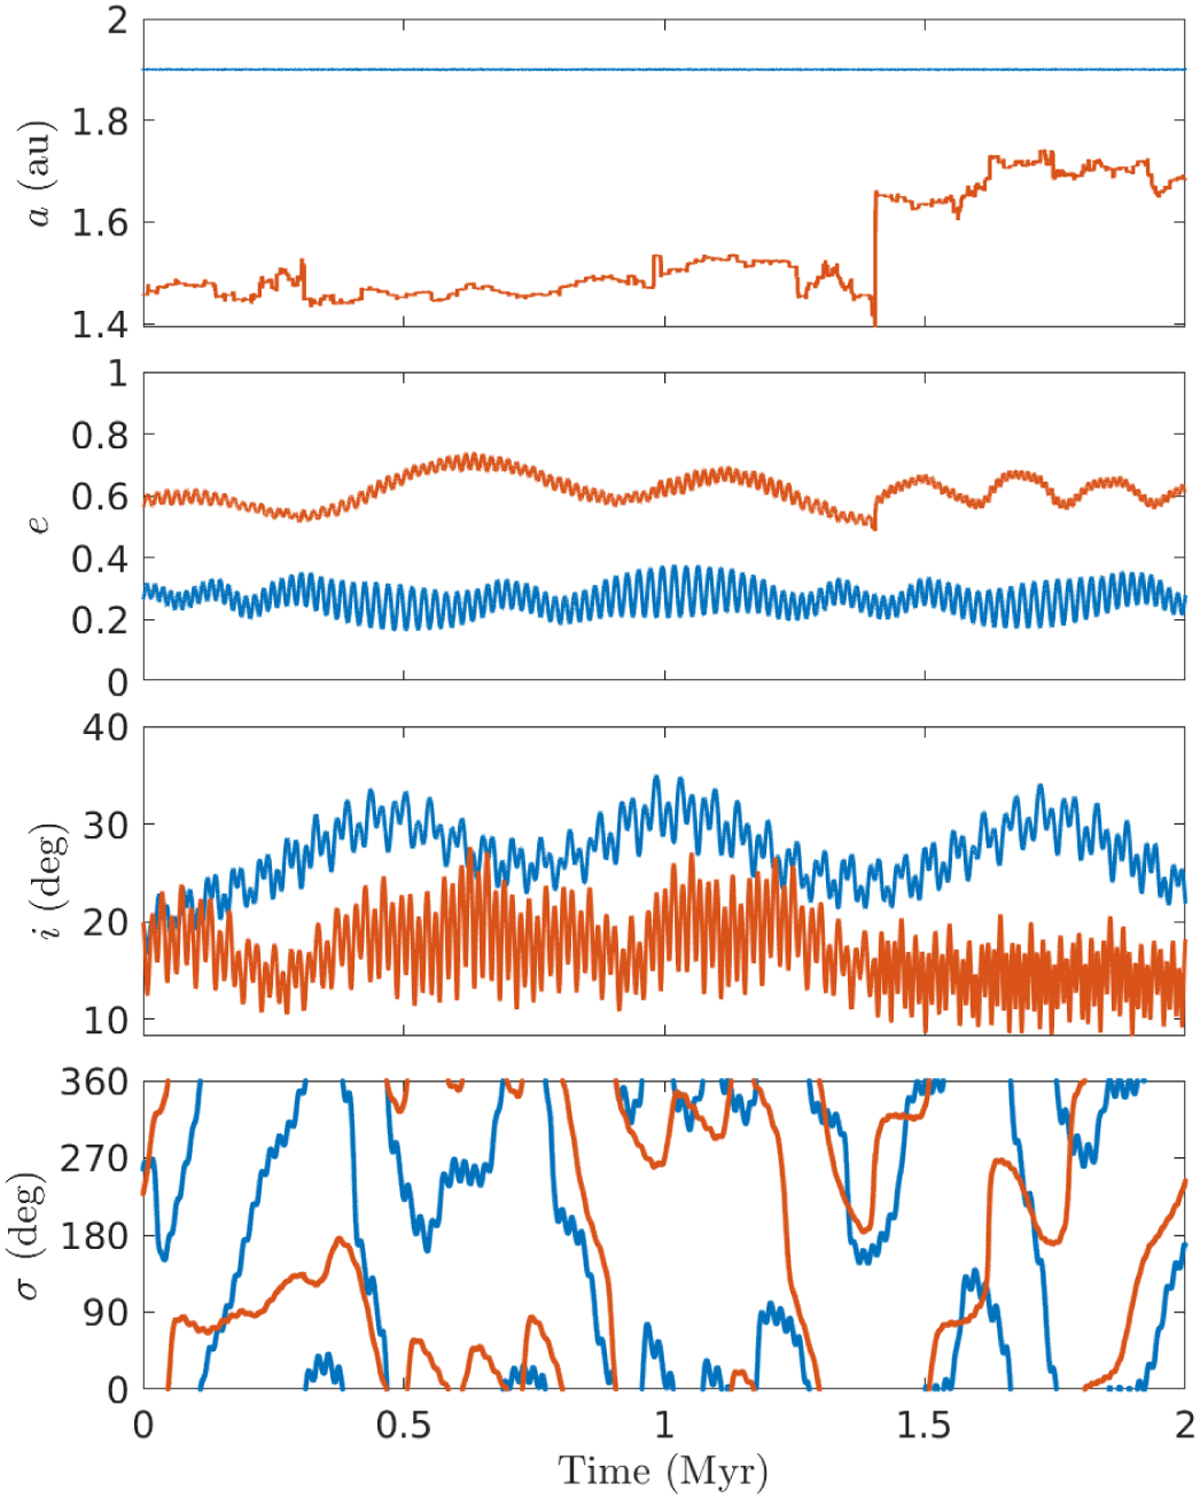
Evolution of a test particle in the v2 (red curve), and another one in the v3 (blue curve) secular resonances. The last panel shows the evolution of the corresponding critical argument σ: ϖ − ϖV (red curve) for v2, and ϖ − ϖE (blue curve) for v3.
Current usage metrics show cumulative count of Article Views (full-text article views including HTML views, PDF and ePub downloads, according to the available data) and Abstracts Views on Vision4Press platform.
Data correspond to usage on the plateform after 2015. The current usage metrics is available 48-96 hours after online publication and is updated daily on week days.
Initial download of the metrics may take a while.