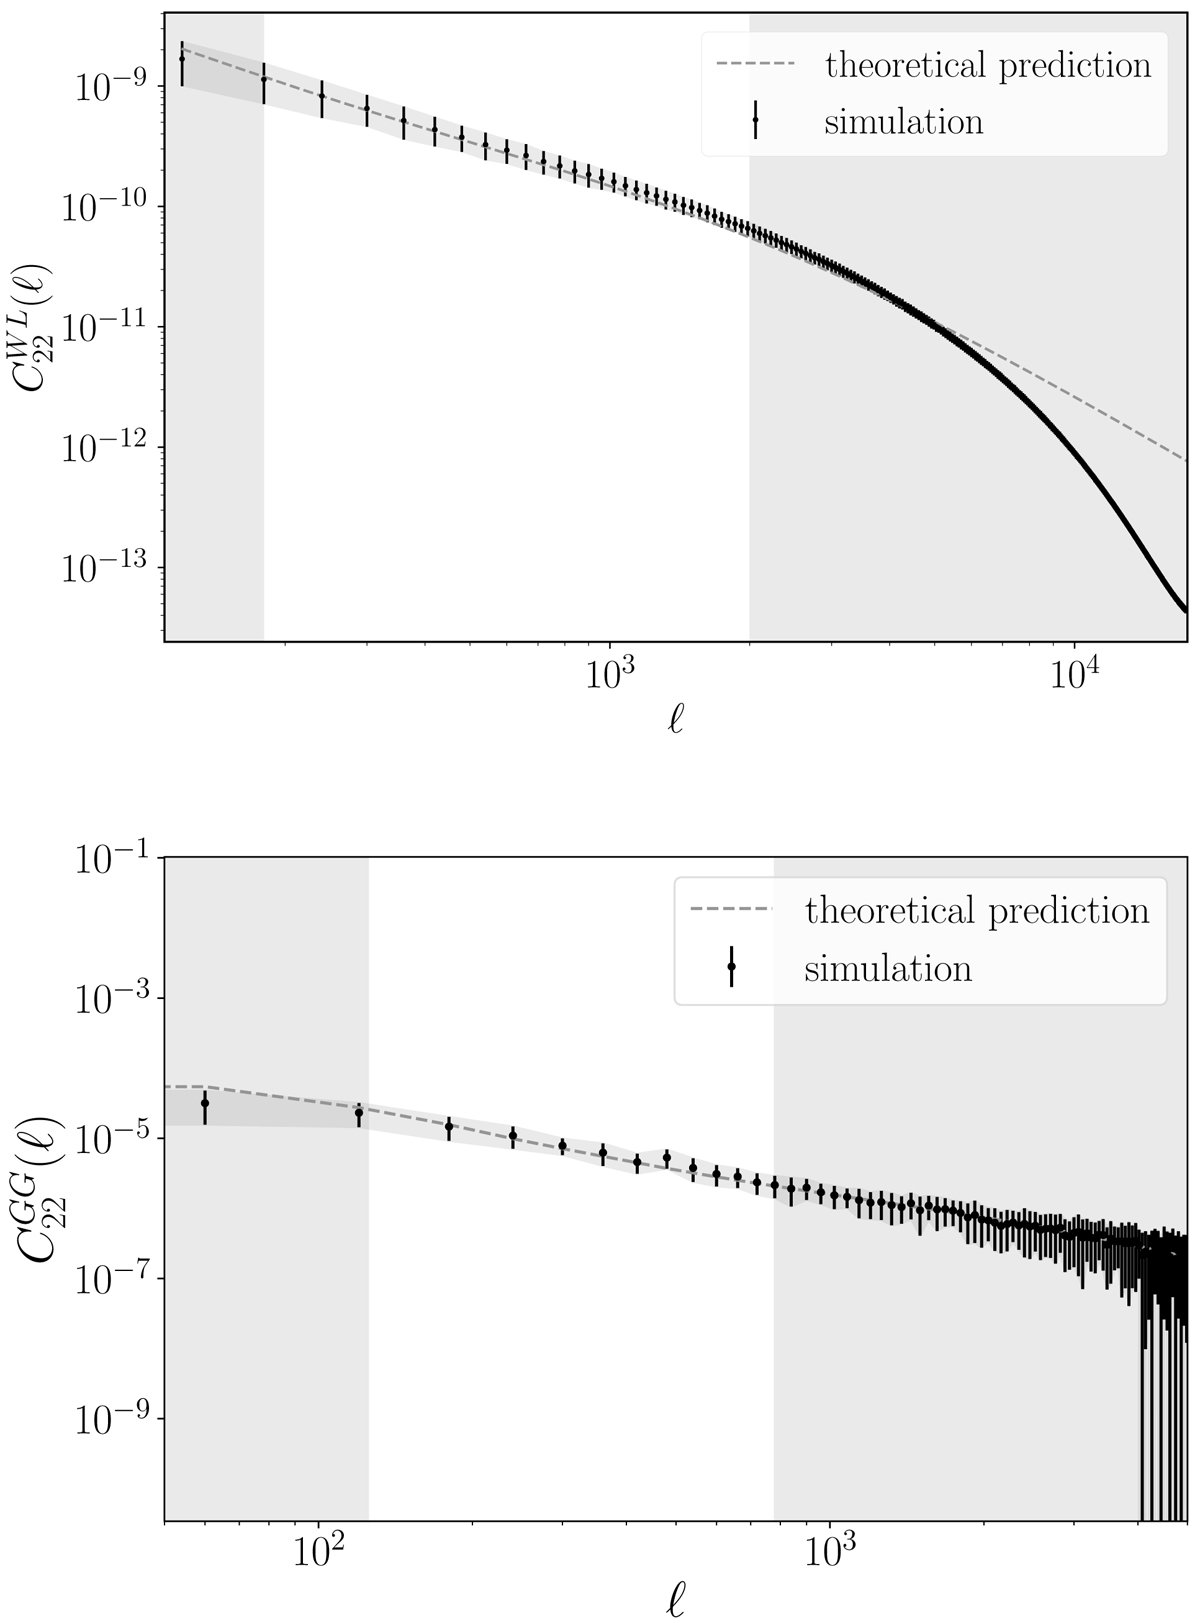
Fig. C.1.
Download original image
Comparison between the power spectrum measured from maps built from the simulations and the corresponding theoretical prediction. Top panel: Weak-lensing power spectrum measured from convergence maps built from the simulations and the corresponding theoretical prediction obtained using https://pypi.org/project/pyccl/. An example of this comparison is shown for the fiducial cosmology of the cosmo-SLICS simulations of the third tomographic bin. Bottom panel: Same, but for the galaxy density map used for clustering.
Current usage metrics show cumulative count of Article Views (full-text article views including HTML views, PDF and ePub downloads, according to the available data) and Abstracts Views on Vision4Press platform.
Data correspond to usage on the plateform after 2015. The current usage metrics is available 48-96 hours after online publication and is updated daily on week days.
Initial download of the metrics may take a while.