Fig. 10
Download original image
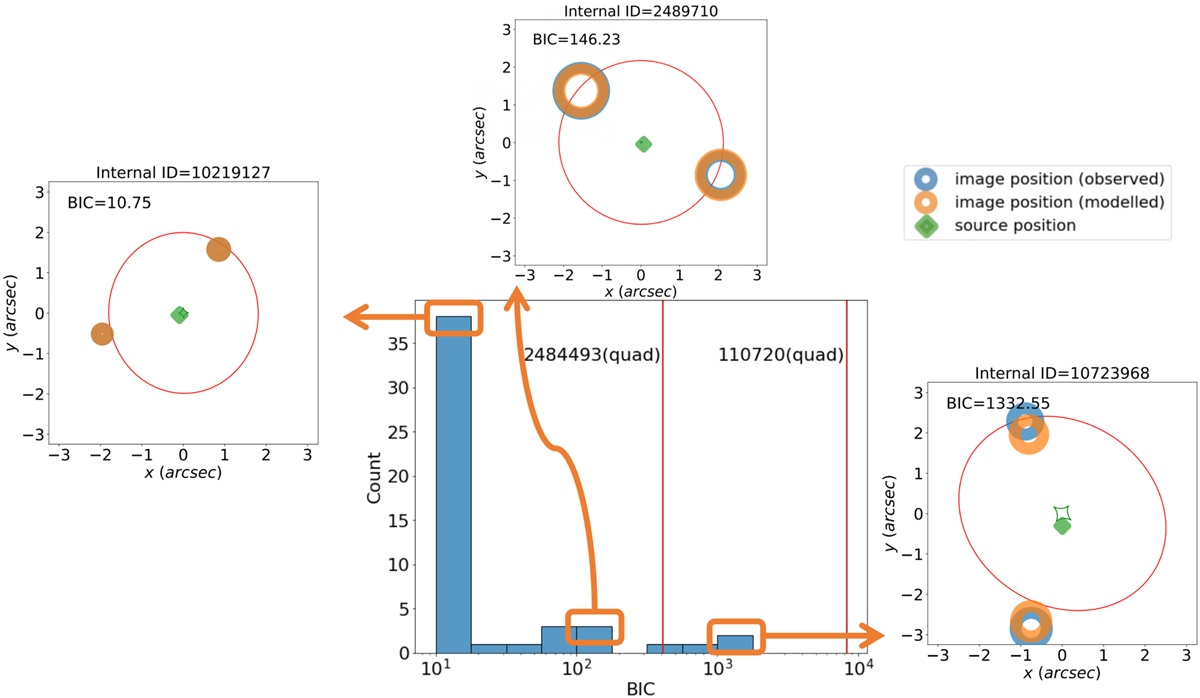
Distribution of BICs of the 52 lensing models. BICs of two-image systems are represented by histograms, while vertical orange lines indicate the BICs of the two quad systems. In the square panels, blue circles show the observed image positions, orange circles show the modelled image positions, and green diamonds show the source positions given by the lens models. The green and red curves indicate the caustic and critical curves of the corresponding lensing models.
Current usage metrics show cumulative count of Article Views (full-text article views including HTML views, PDF and ePub downloads, according to the available data) and Abstracts Views on Vision4Press platform.
Data correspond to usage on the plateform after 2015. The current usage metrics is available 48-96 hours after online publication and is updated daily on week days.
Initial download of the metrics may take a while.