Open Access
Fig. 1
Download original image
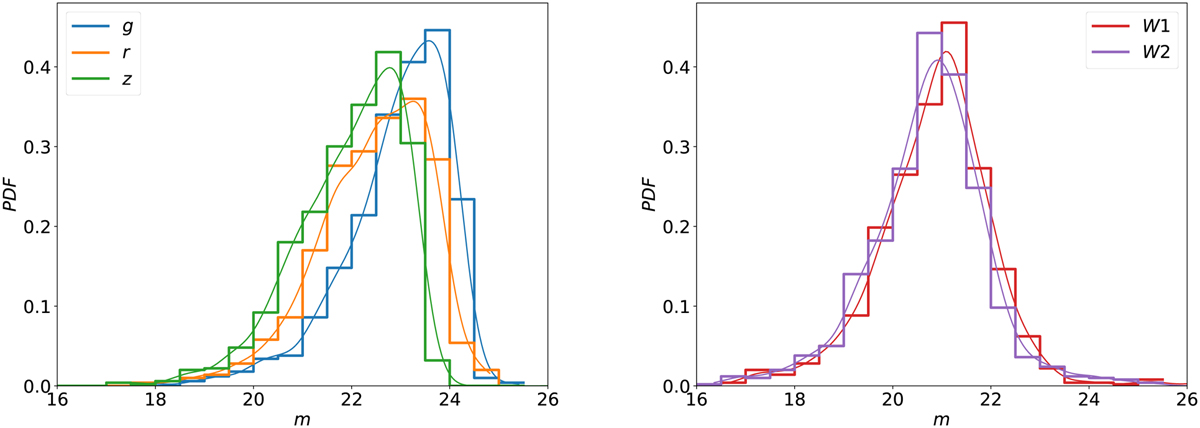
Magnitude distributions of the QCC in g, r, z (left panel) and W1, W2 (right panel). The kernel density estimate curves (solid lines) are generated by kdeplot in seaborn package with binsize = 0.5 and the default Gaussian kernel.
Current usage metrics show cumulative count of Article Views (full-text article views including HTML views, PDF and ePub downloads, according to the available data) and Abstracts Views on Vision4Press platform.
Data correspond to usage on the plateform after 2015. The current usage metrics is available 48-96 hours after online publication and is updated daily on week days.
Initial download of the metrics may take a while.