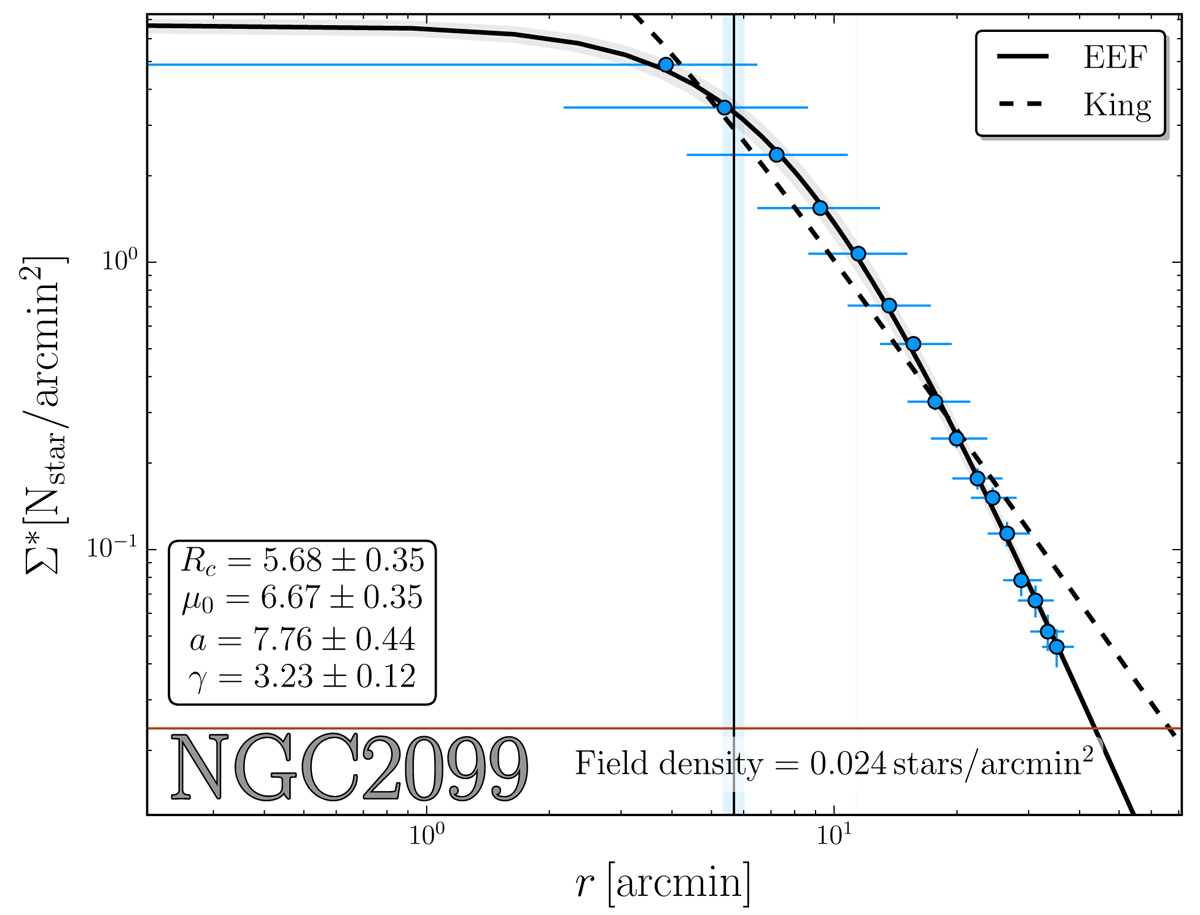
Fig. 4.
Download original image
Density profile of NGC 2099. Azure points with error bars represent the observed stellar density profile. The black solid line indicates the best-fitting EEF (Elson et al. 1987) profile, while the corresponding uncertainty is indicated by the gray shaded area. The inferred core radius is indicated with the black solid vertical line, while the shaded region is its uncertainty. The best-fitting parameters are quoted in the bottom-left inset. The dashed line shows the best-fitting King (King 1962) profile.
Current usage metrics show cumulative count of Article Views (full-text article views including HTML views, PDF and ePub downloads, according to the available data) and Abstracts Views on Vision4Press platform.
Data correspond to usage on the plateform after 2015. The current usage metrics is available 48-96 hours after online publication and is updated daily on week days.
Initial download of the metrics may take a while.