Fig. 2
Download original image
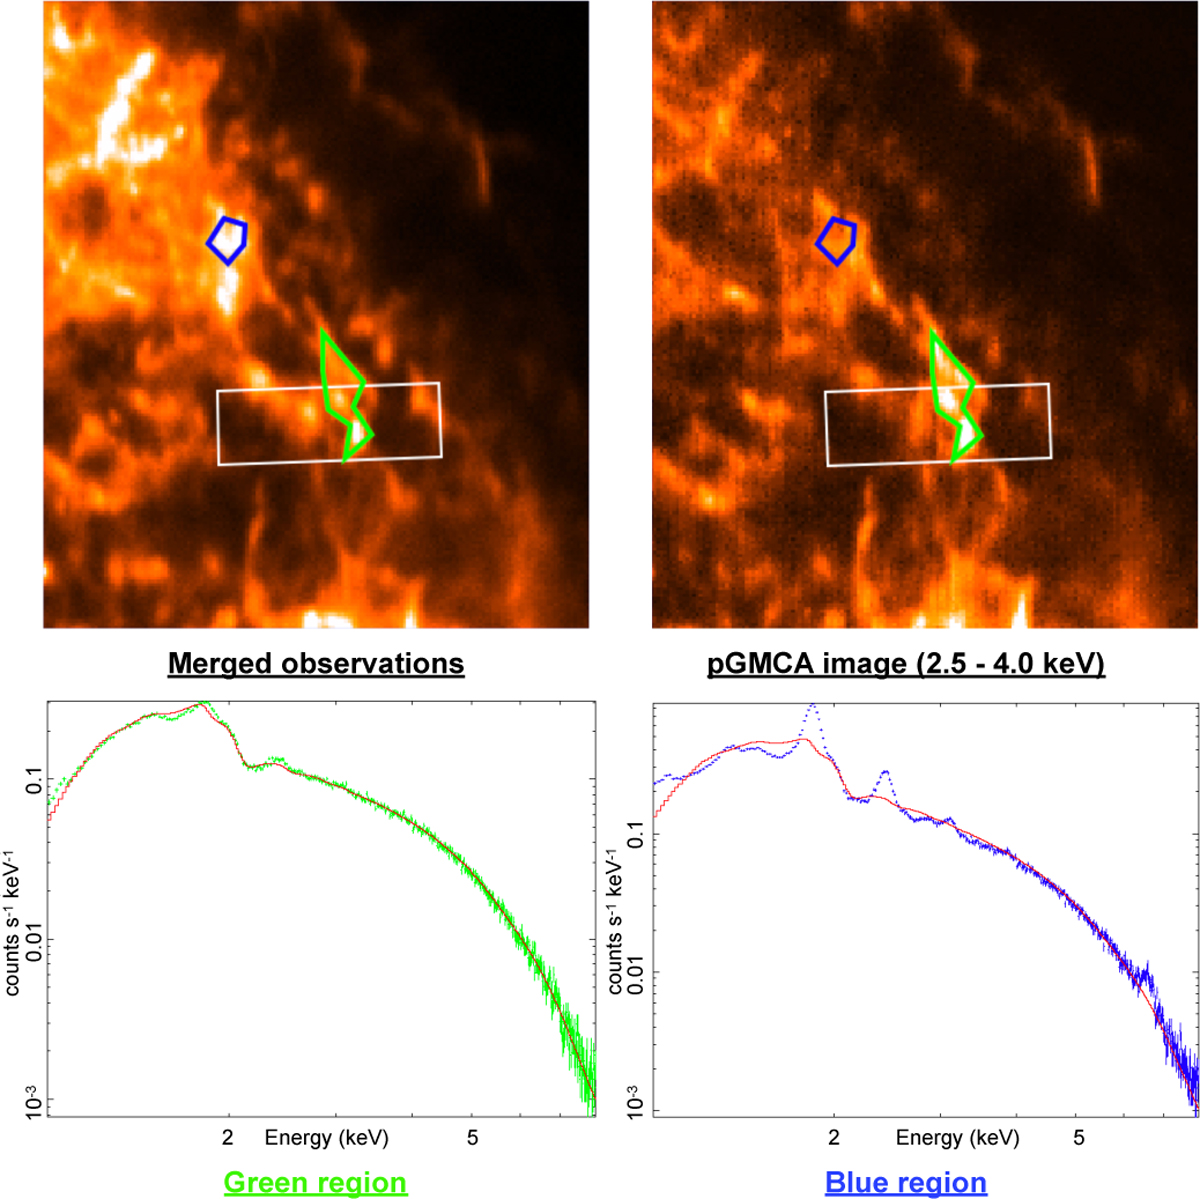
Assessment of the non-thermal nature of the filamentary structures found by pGMCA. The northeast region of Cas A from our merged observations is shown in the top left panel. The top right panel shows an image of the synchrotron retrieved by our method on the 2.5–4 keV band. The blue and green contours in these latter two panels show the regions of extraction, and the white rectangle shows the fourth reverse shock box from Fig. 1. The extracted spectra from these two regions are shown in the panels below, both fitted with a simple phabs*powerlaw model in Xspec in red.
Current usage metrics show cumulative count of Article Views (full-text article views including HTML views, PDF and ePub downloads, according to the available data) and Abstracts Views on Vision4Press platform.
Data correspond to usage on the plateform after 2015. The current usage metrics is available 48-96 hours after online publication and is updated daily on week days.
Initial download of the metrics may take a while.