Open Access
Fig. 1
Download original image
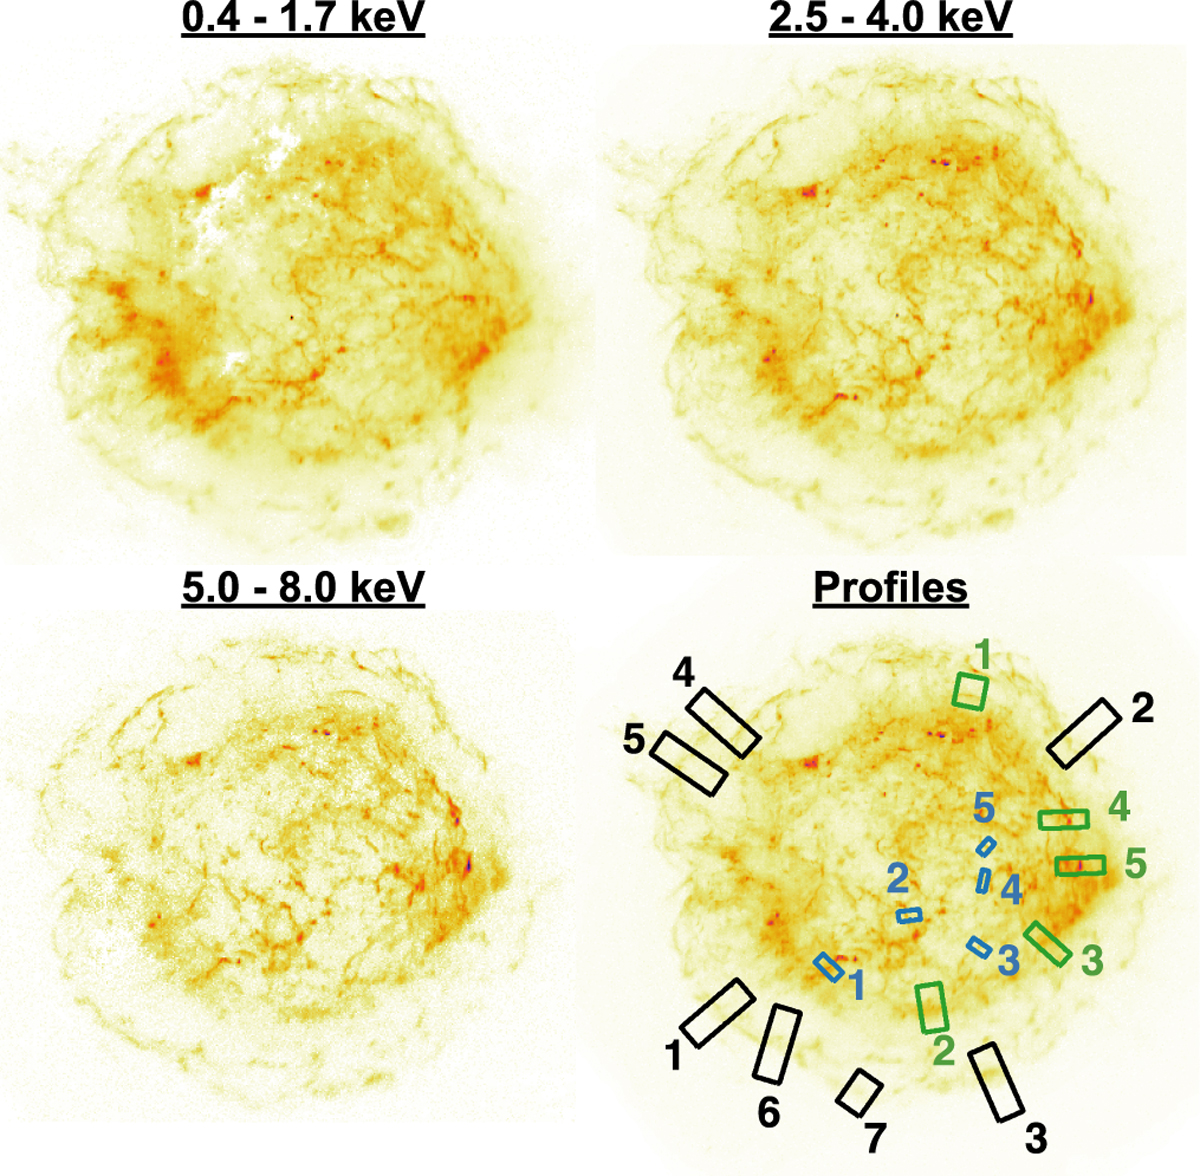
Synchrotron emission obtained with pGMCA in three energy bands, with square-root scaling. The boxes used to define the filament profiles are shown in the bottom right corner. The profiles at the forward shock, the reverse shock, and those that are unidentified are shown in black, green, and blue, respectively.
Current usage metrics show cumulative count of Article Views (full-text article views including HTML views, PDF and ePub downloads, according to the available data) and Abstracts Views on Vision4Press platform.
Data correspond to usage on the plateform after 2015. The current usage metrics is available 48-96 hours after online publication and is updated daily on week days.
Initial download of the metrics may take a while.