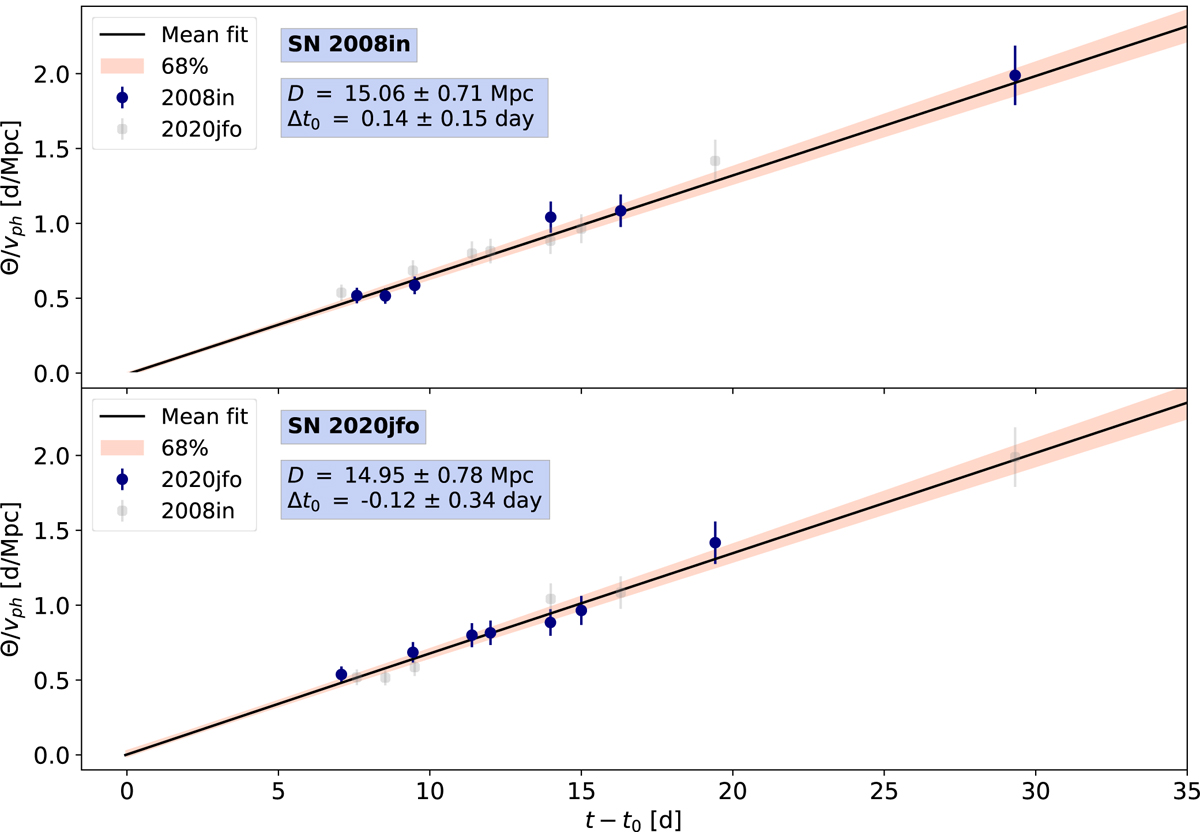
Fig. 5.
Download original image
Evolution of Θ/vph for SNe 2008in (top panel) and 2020jfo (bottom panel). The derived distance, D, and the final time of explosion estimate (with respect to the initial light curve fit-based value), Δt0, are displayed in the top left corner of each panel. The shaded region shows the 68% confidence interval of the fit. The displayed uncertainties denote the 1σ errors on Θ/vph.
Current usage metrics show cumulative count of Article Views (full-text article views including HTML views, PDF and ePub downloads, according to the available data) and Abstracts Views on Vision4Press platform.
Data correspond to usage on the plateform after 2015. The current usage metrics is available 48-96 hours after online publication and is updated daily on week days.
Initial download of the metrics may take a while.